

City Map
One Platform. Every Stakeholder. All Data-Points.
Real-time Analytics & Ai-driven Workflow Automation System
Built for Intelligence.
Engineered for Ease.
Powered for Action.
City Map is a SAAS spatial intelligence system that provides situational and operational awareness in urban contexts.
It centralises data, connects teams, automates analytics and workflows, and generates real-time insights and reports.
Modular by design and validated in the field, it serves a wide range of sectors including urban planning, infrastructure, utilities, heritage, asset management, and real estate.
Prioritising Optimisation & Automation
City Map provides full situational awareness of spatial assets - empowering teams with the clarity, automation, and speed needed to work smarter and more efficiently.
Interface Demo - PC (Beta)
-
![Dashboard displaying weather, district KPIs, and alerts for Amman, Jordan. Current weather hot at 31°C, with forecasts for the week. Pie chart of KPI distribution by district, bar chart of notification criticality, and various urban KPIs including infrastructure projects, traffic incidents, water efficiency, air quality, public transport, and safety index.]()
Home
Main City Dashboard
-
![Interactive urban intelligence platform map showing various colored icons representing community notes, safety alerts, traffic, utilities, environment, public events, new construction, and road closures over a city map. The interface includes navigation buttons, date filters, and a weather widget showing 29°C and partly cloudy weather.]()
Live View
Loading live spatial data in 2D and 3D from GIS libraries, 3D/BIM assets, IoT sensors, and fieldwork operations.
-
![CityMap - Urban Intelligence Platform dashboard showing traffic event trends and traffic activity index across districts, with date range and district filter options.]()
Analytics 01: City Wide View
City wide analytics across wide domains, like Traffic, Zoning, Demographics or Public Safety.
-
![Screenshot of an urban intelligence platform dashboard displaying a pie chart of building use composition, key performance indicators for housing, and an event timeline related to housing in Sweileh.]()
Analytics 02: Region-Specific View
Region-Specific analytics across wide domains, like Traffic, Zoning, Demographics or Public Safety.
-
![Screenshot of an AI-powered urban intelligence platform dashboard showing various alerts, including a significant water leak, substation overload, traffic congestion in 7th Circle area, elevated PM10 pollution levels in Jabal Amman, and an increase in emergency service requests.]()
Flash Ai
Ai Driven Insights of aggregated data for actionable items like tasks, recommendations and warnings.
-
![Dashboard of CityMap Urban Intelligence Platform showing project performance data, project status distribution pie chart, team roles bar chart, and current projects portfolio with project statuses.]()
Teams: Departments Page
City Departments, Operations & Projects: Tasks Management, Progress and Performance Analytics and Human Resource Competence Metrics.
-
![Screenshot of a professional profile dashboard for Ms. Fatima Al-Khaledi, Senior Project Manager, showing key information such as contact details, recent attendance, project contributions, and performance metrics within an urban intelligence platform.]()
Teams: Profile Page
Human Resources, Operations & Projects: Tasks Management, Progress and Performance Analytics and Human Resource Competence Metrics.
-
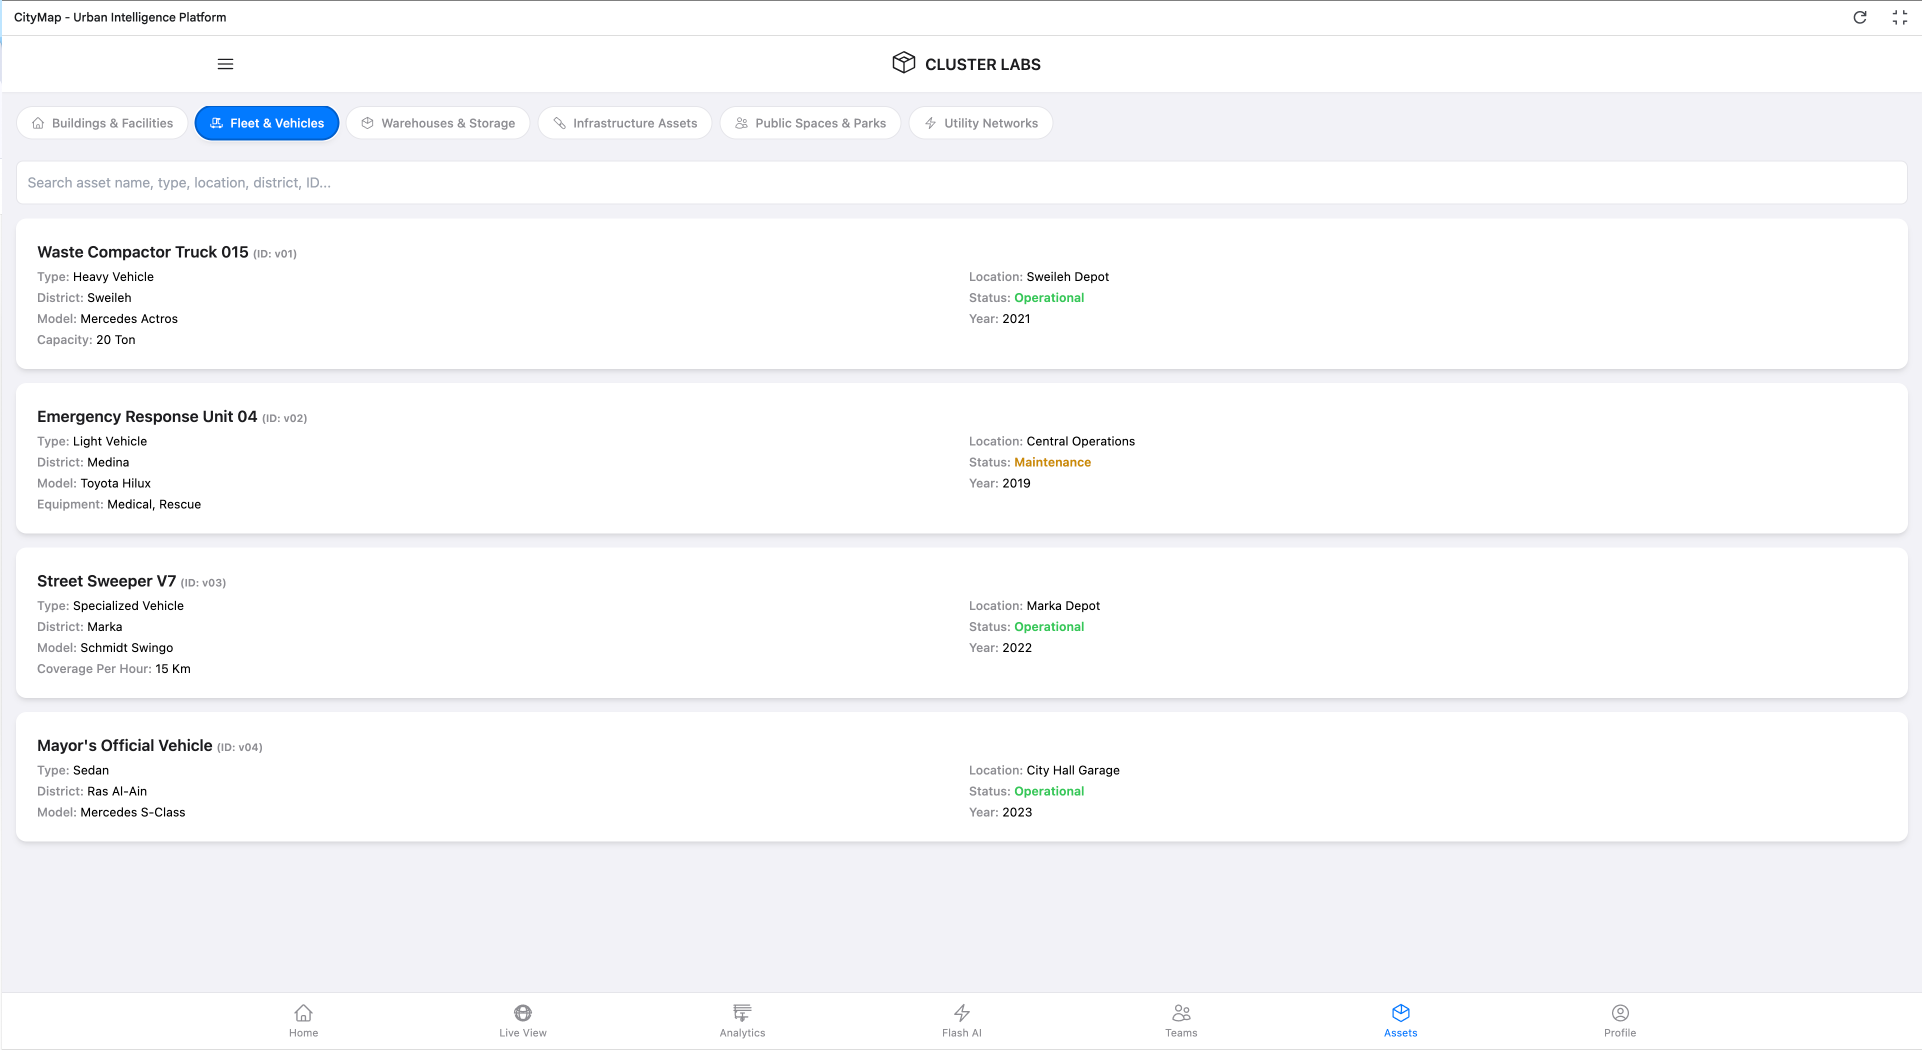
![Screenshot of CityMap - Urban Intelligence Platform showing a list of fleet and vehicle assets, including a waste compactor truck, emergency response unit, street sweeper, and mayor's official vehicle with their details and statuses.]()
City Assets Section
Comprehensive overview and digital access to assets like buildings, CCAMS, fleet, inventories or sensors.
-
![Dashboard for CityMap - Urban Intelligence Platform showing key decisions, strategic meetings, projects, financial overview, strategic initiatives, key schedule, and team information with various charts and data summaries.]()
Mayor's Page
Major City KPI’s, Mayoral Milestones, Financial Section & City Hall Calendar.


Interface Demo - Mobile (Beta)
-
![Screen showing the Cluster Labs app logo, a black geometric cube, with the text "CLUSTER LABS" below it, and a footer reading "City Map Demo ◆ Cluster Labs ◆ 2025."]()
Screen 0
Spash!
-
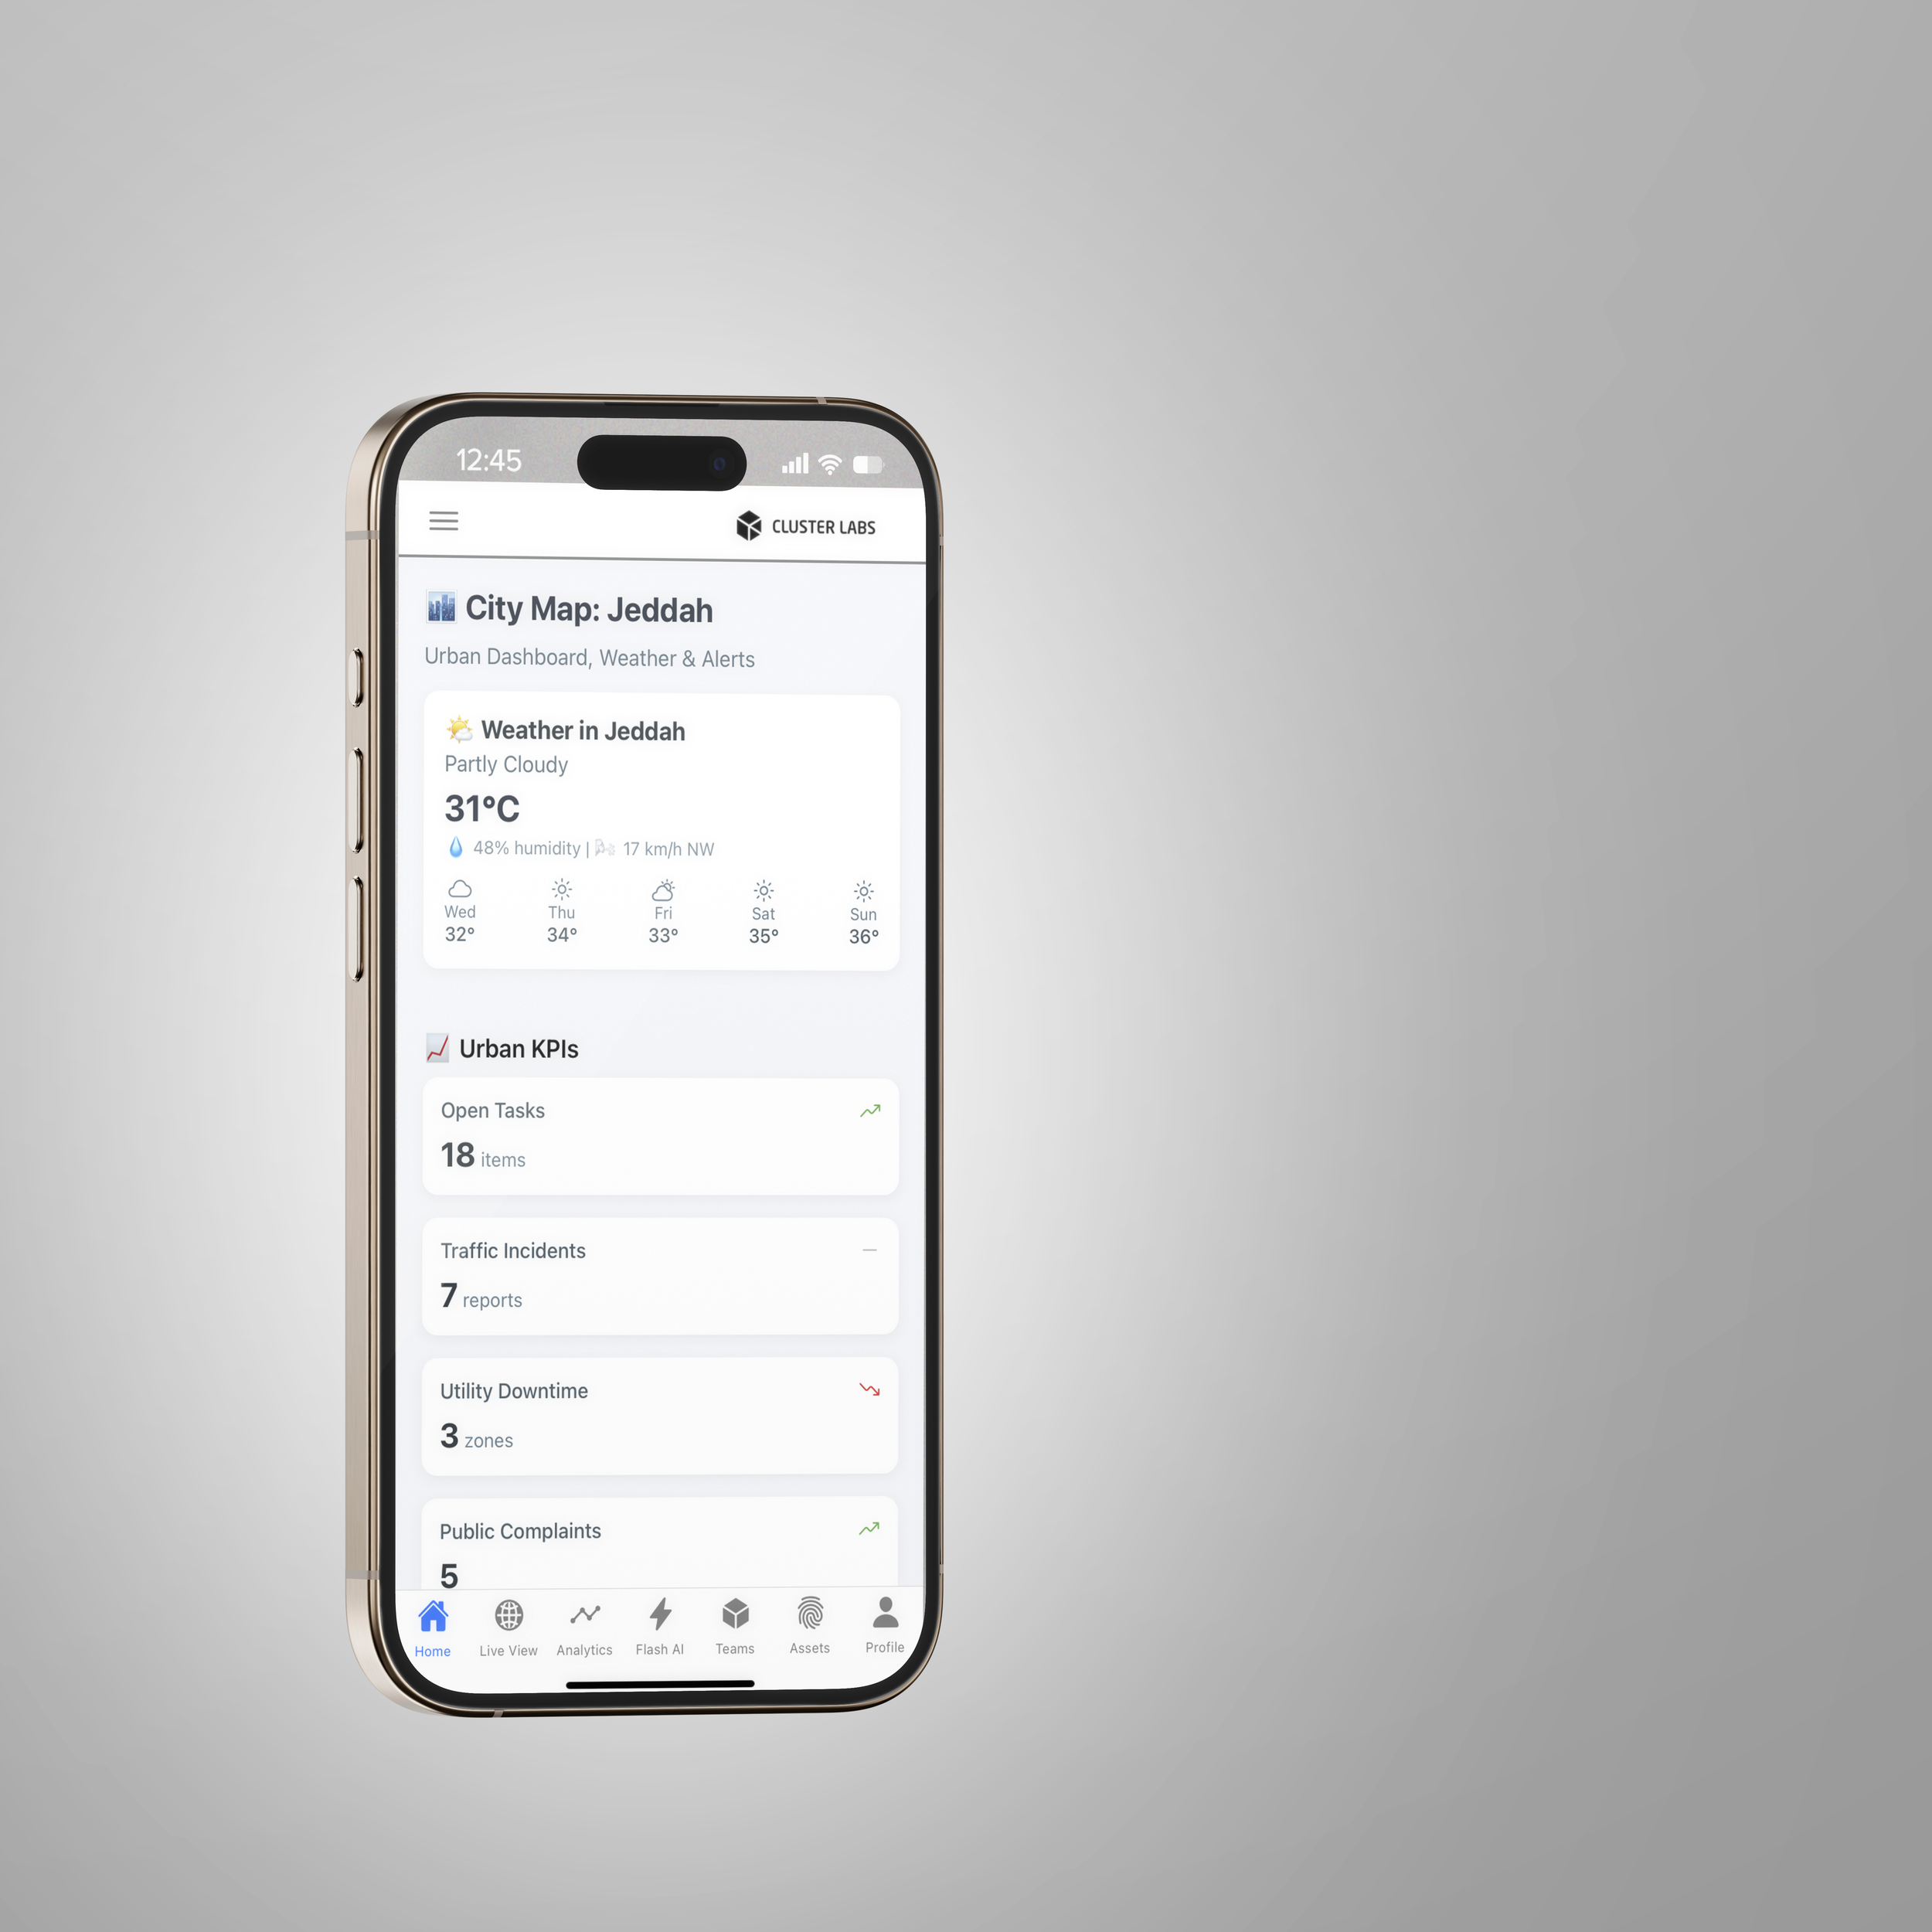
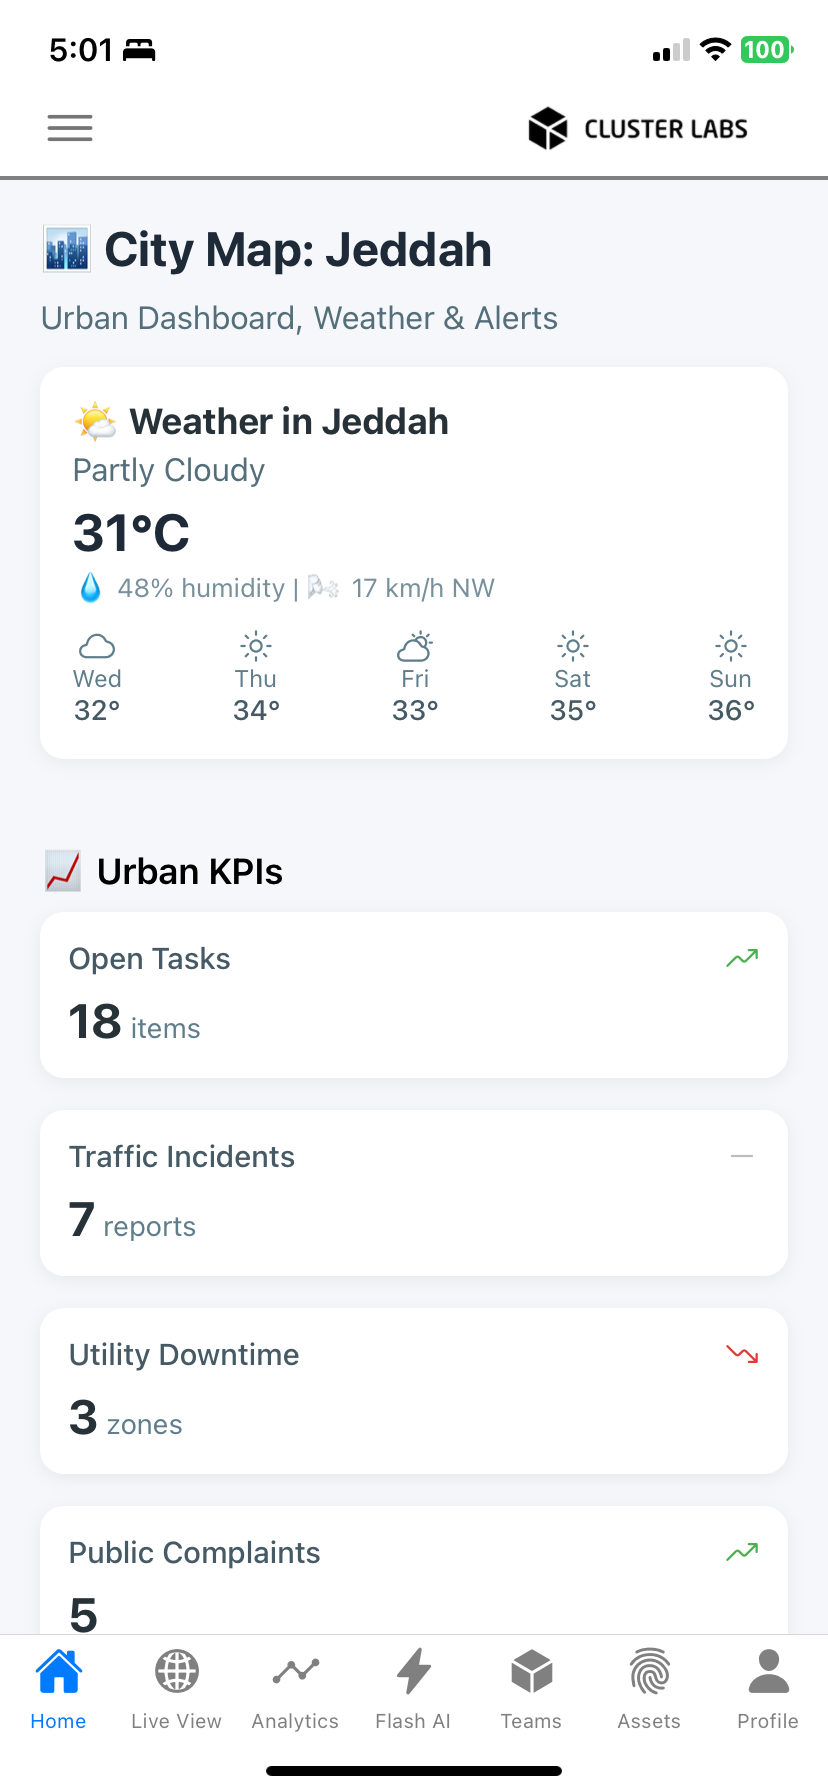
![Screenshot of a city monitoring app showing weather in Jeddah, Saudi Arabia, with partly cloudy skies, temperature of 31°C, humidity at 48%, and forecasted temperatures for the next four days, along with city KPIs and notifications.]()
Home
Home Screen
-
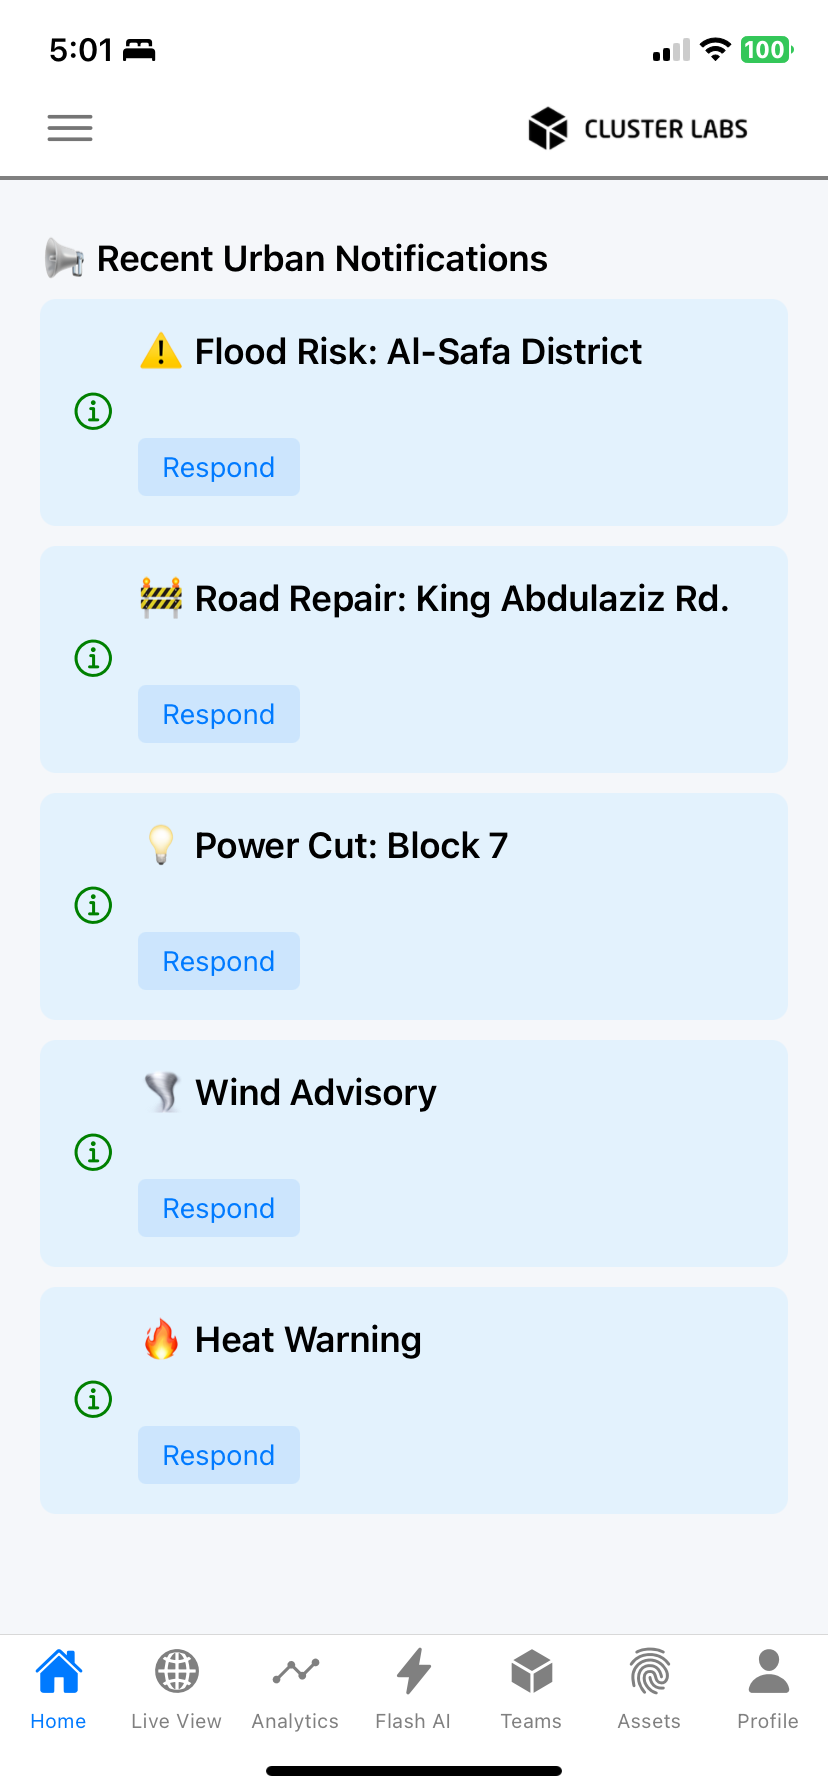
![Mobile app screen showing recent urban notifications including flood risk, road repair, power cut, wind advisory, and heat warning, with respond buttons for each listed notification.]()
Home
Home Screen extended
-
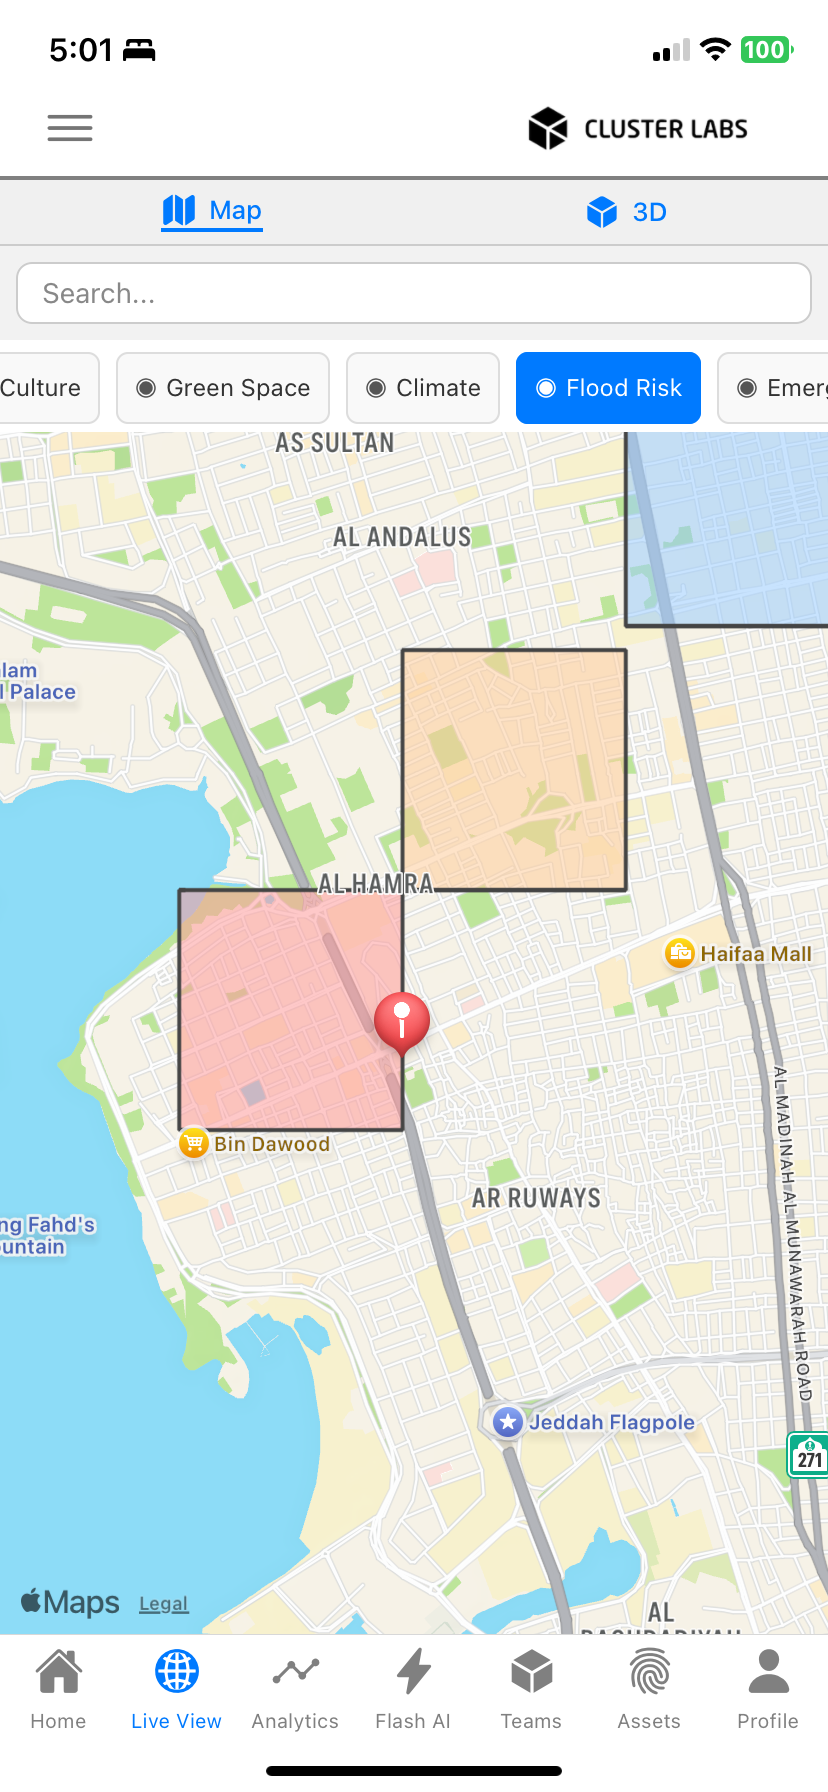
![Map showing flood risk zones around Jeddah, Saudi Arabia, with color-coded areas indicating different flood risk levels and landmarks like Jeddah Flagpole, Haifa Mall, and Bin Dawood.]()
Live View
2D Map - Flood Risk Analytics
-
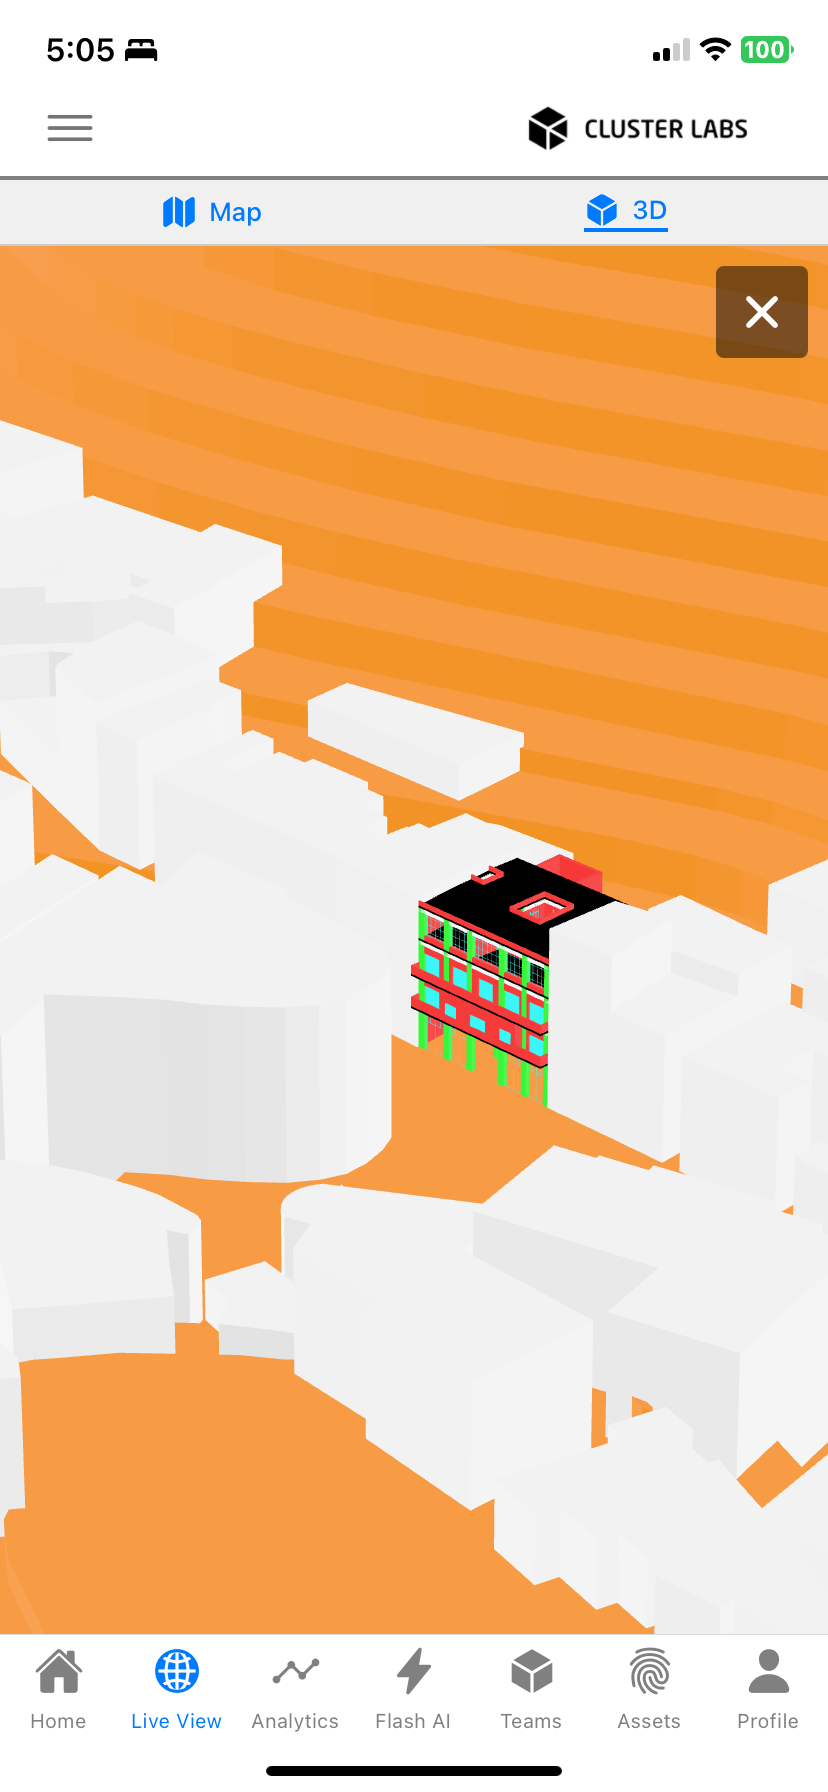
![3D building model with various colored sections, showing an interactive interface of a building design or analysis app.]()
Live View
3D City Viewer (Digital-Twin)
-
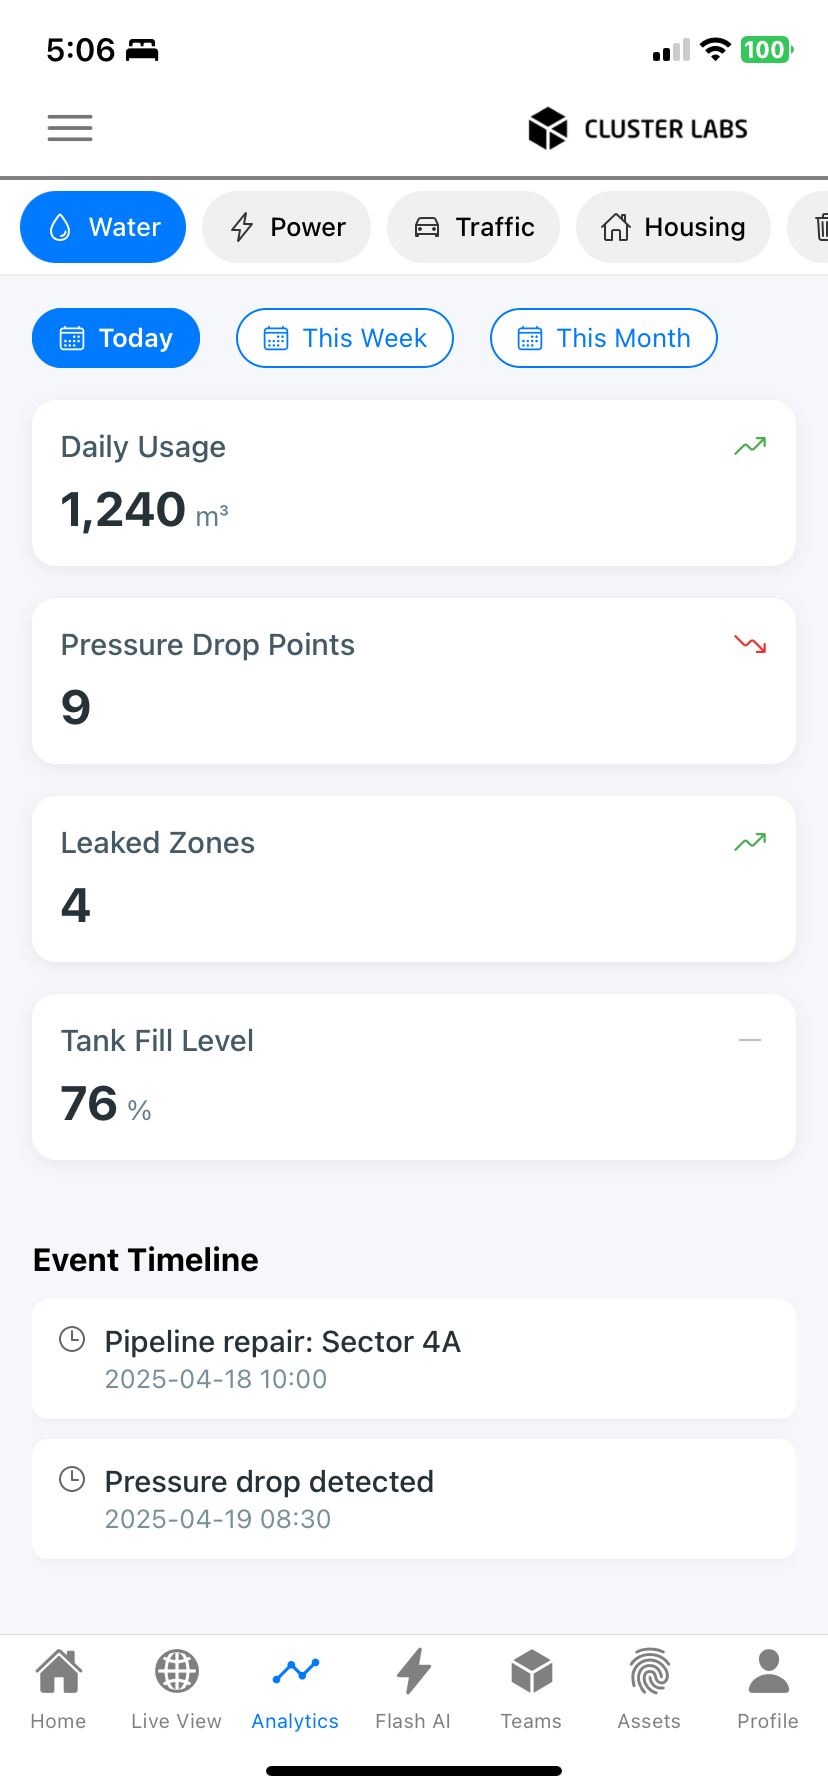
![Dashboard screenshot showing water usage metrics, including daily usage of 1240 cubic meters, pressure drop points at 9, leaked zones at 4, and tank fill level at 76 percent. Event timeline indicates pipeline repair in Sector 4A on April 18, 2025, and pressure drop detected on April 19, 2025.]()
Reports & Analytics
Today’s View - Water Section
-
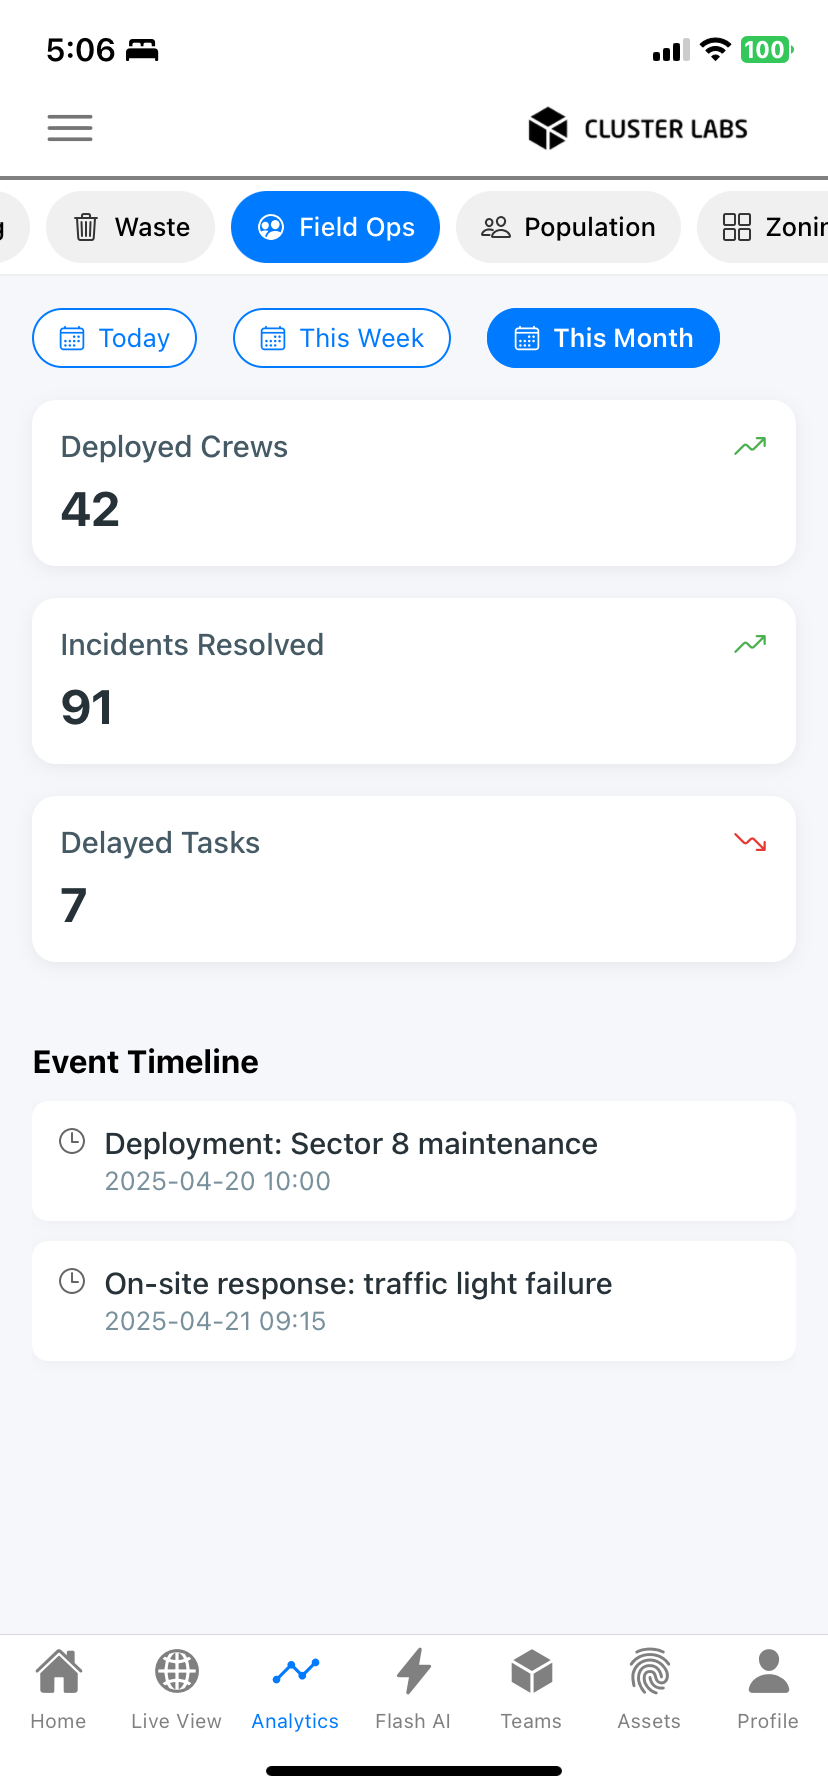
![Dashboard showing field operations data with 42 deployed crews, 91 incidents resolved, and 7 delayed tasks, along with upcoming events and a navigation menu.]()
Reports & Analytics
Month’s View - Field Ops Section
-
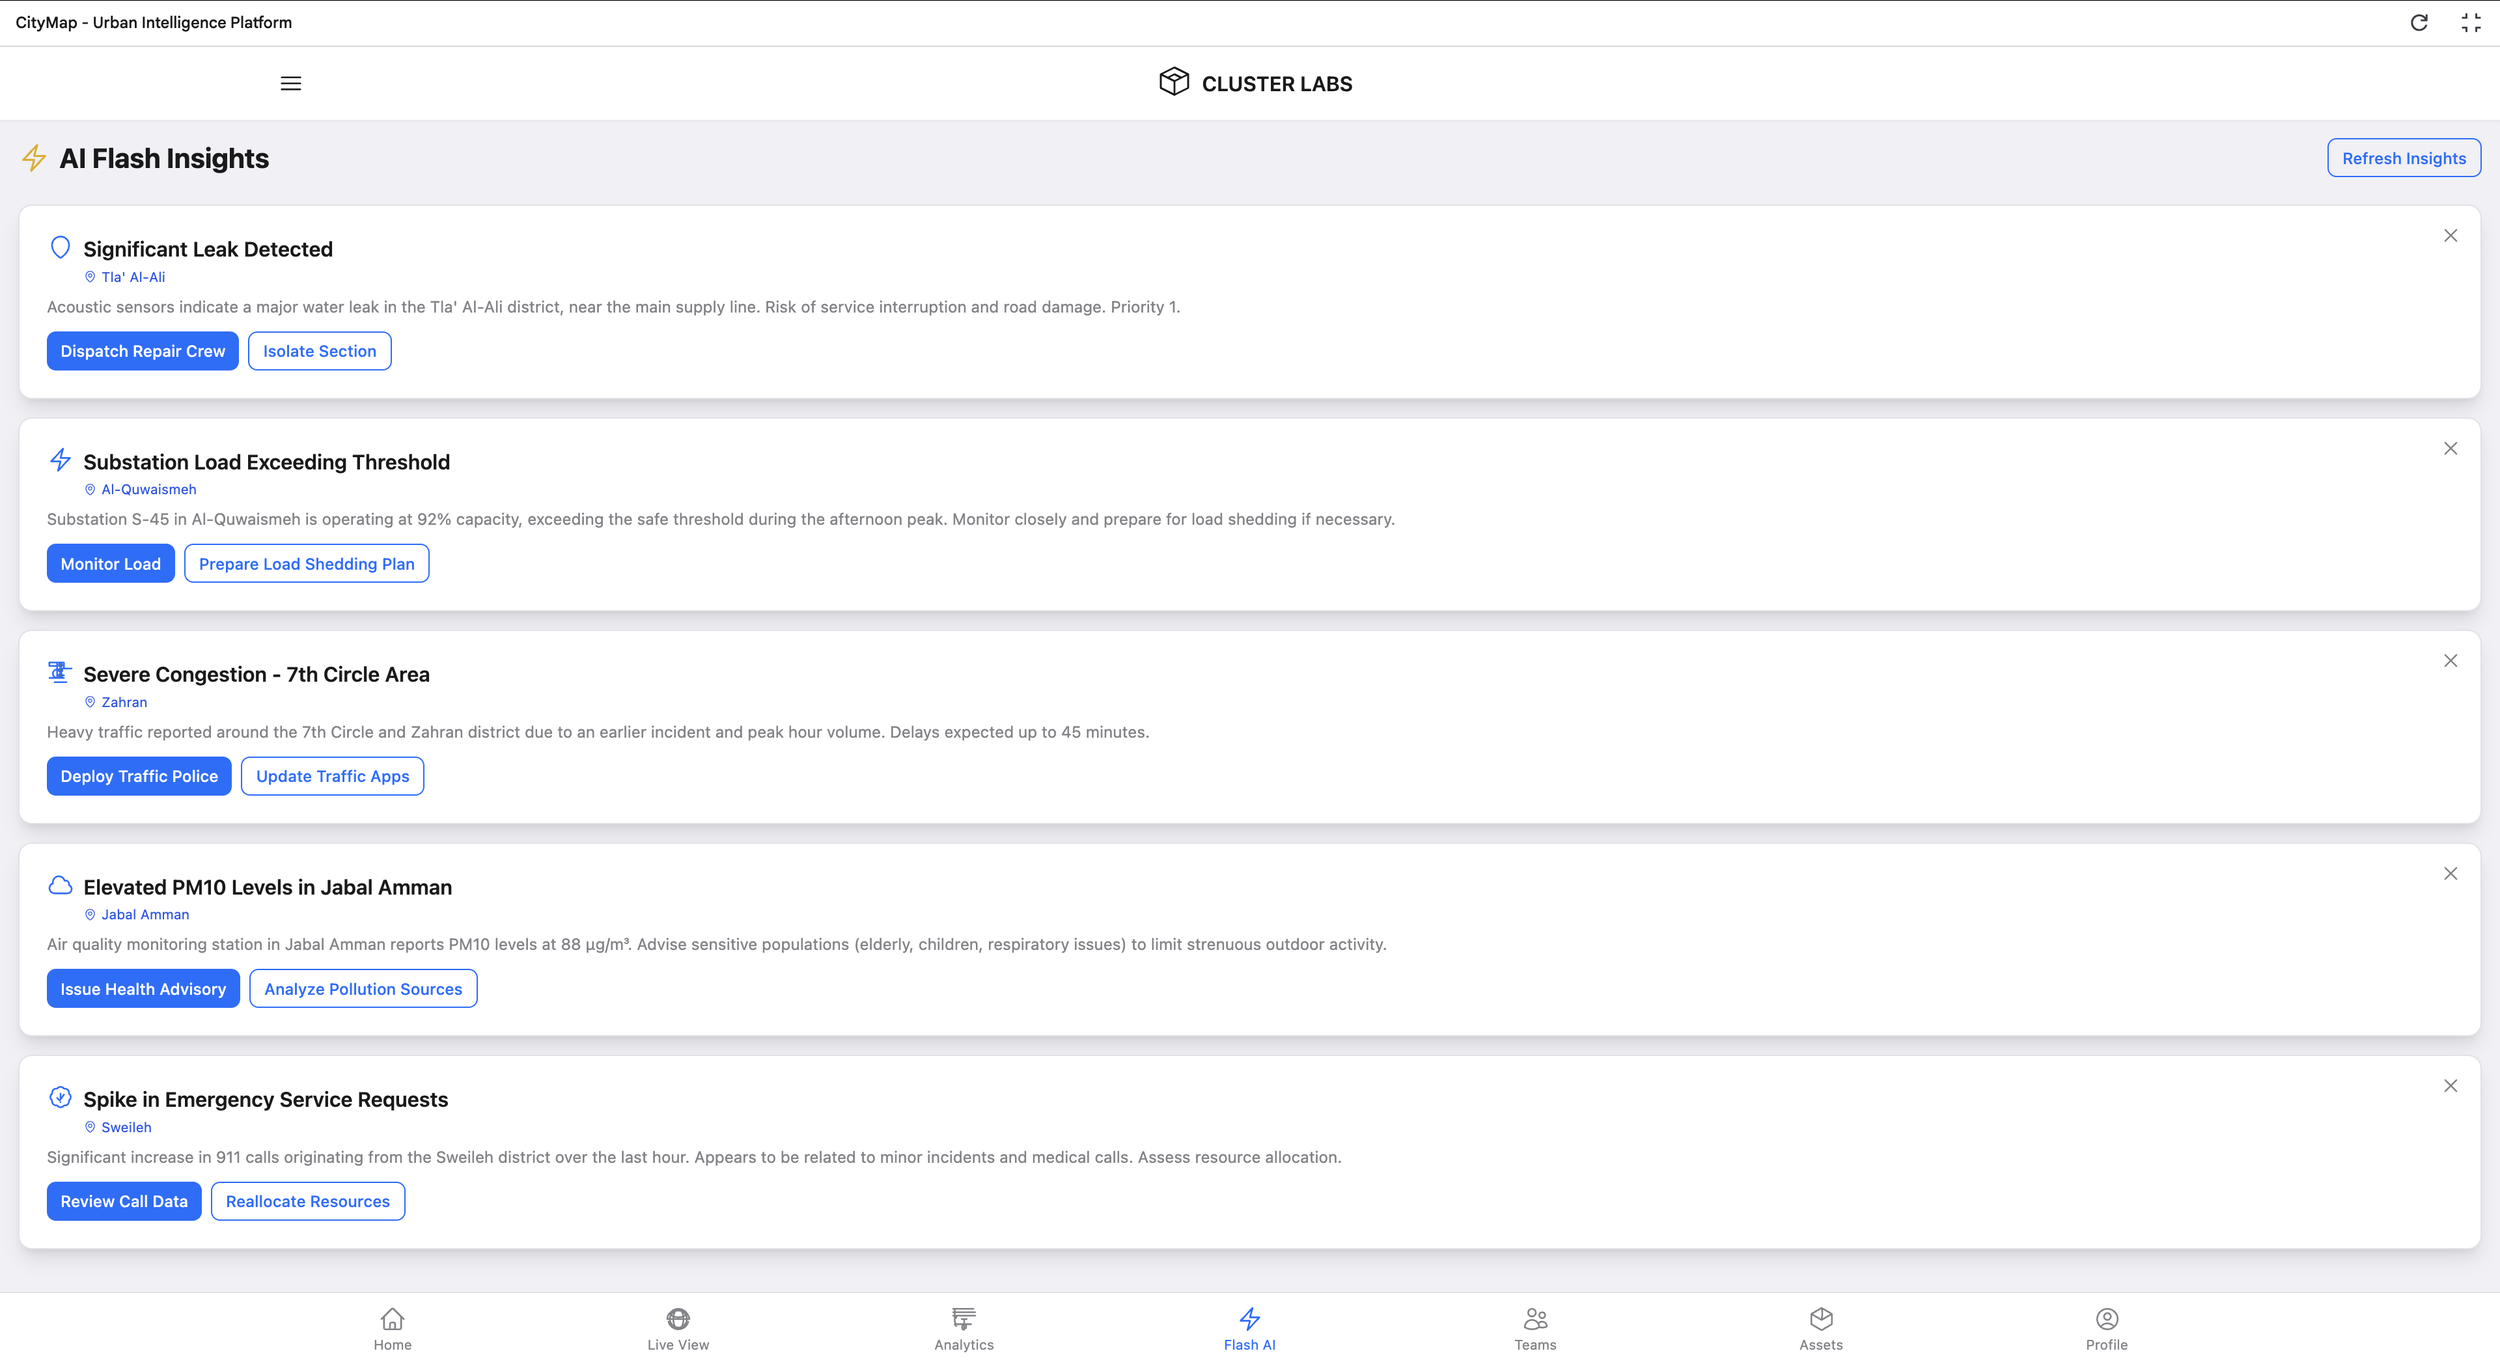
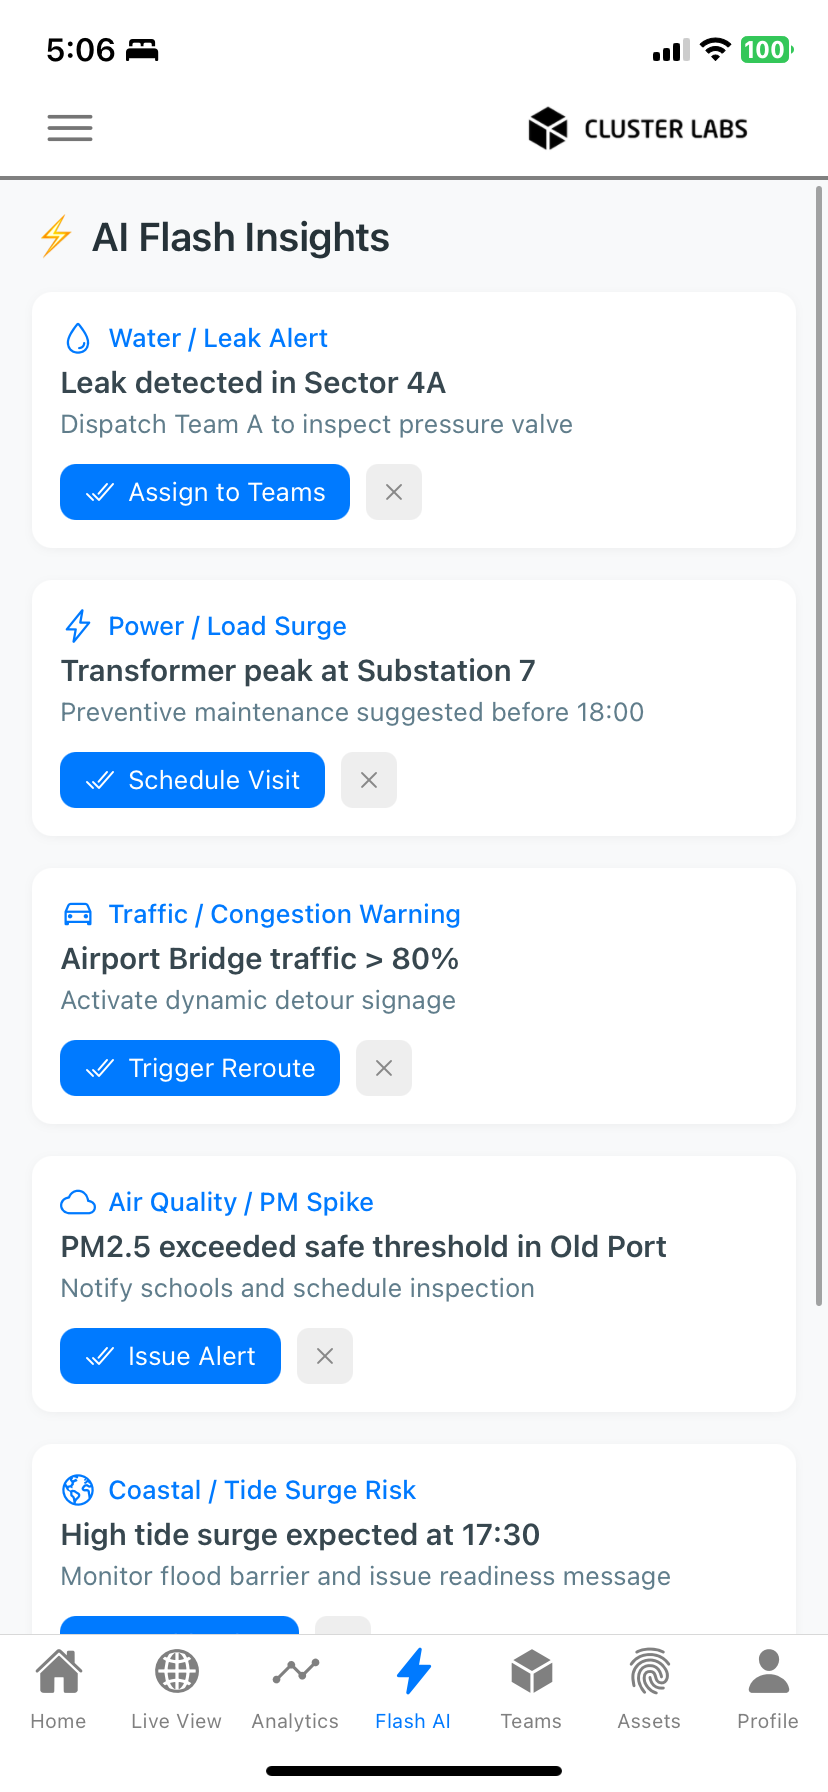
![Screenshot of a mobile app showing various AI flash alerts related to water leaks, power surges, traffic congestion, air quality, and tide risks with options to assign, schedule, trigger, or issue alerts.]()
Flash Ai
Actionable Insights & Task Automation
-
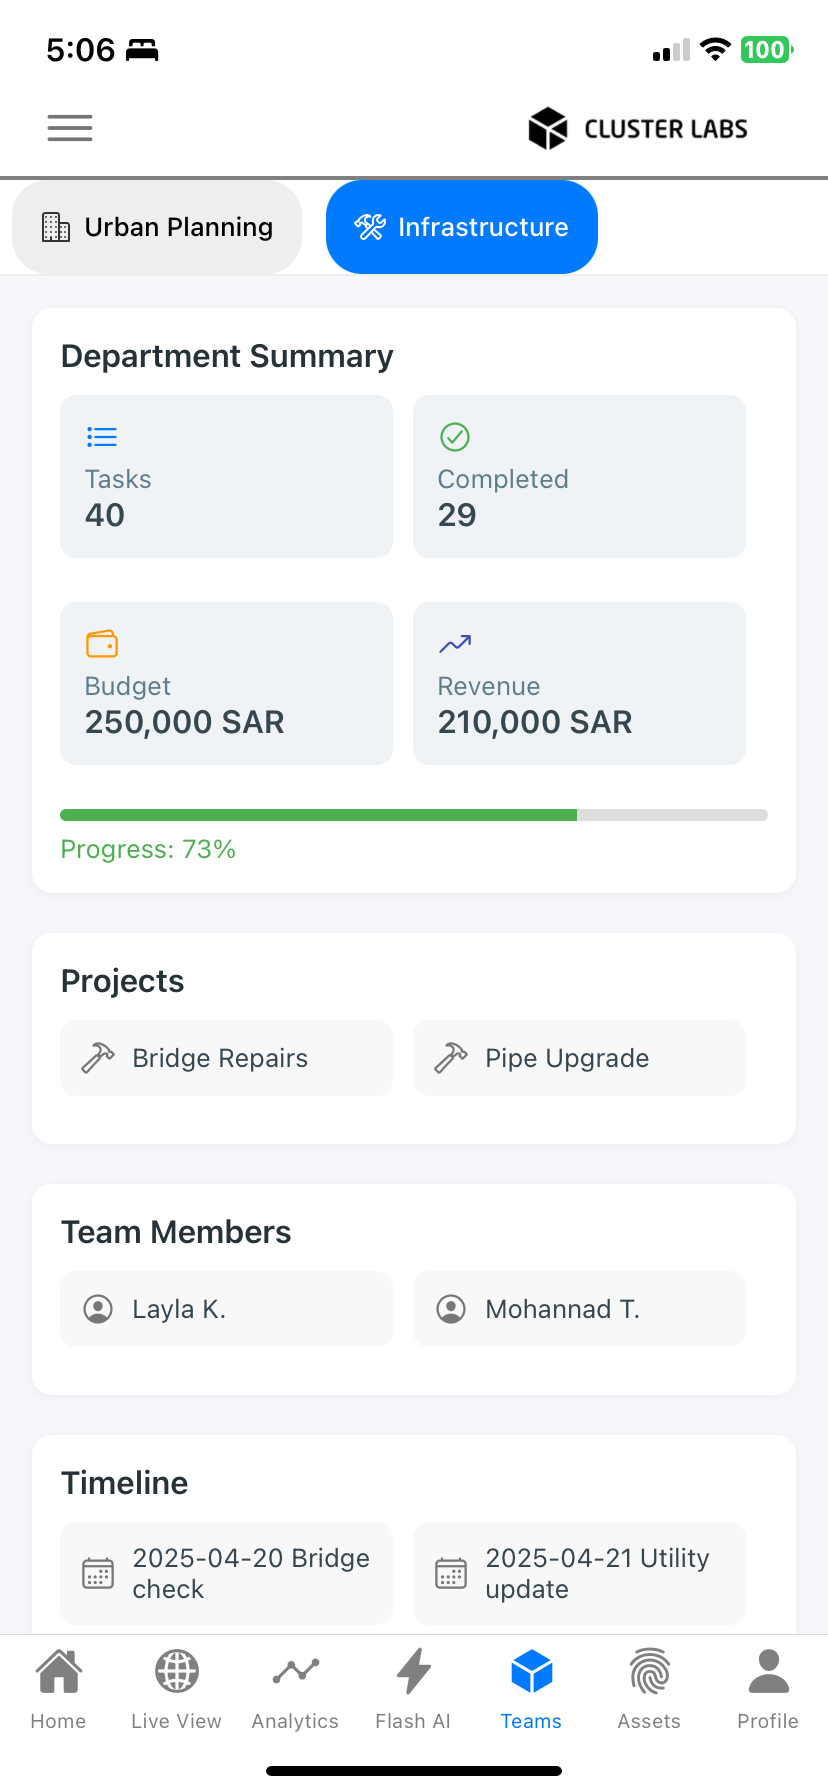
![Screenshot of a project management app showing an infrastructure dashboard with department summary, project details, team members, and timeline updates.]()
Teams & Departments
Department Summaries, overview projects, performance and timelines.
-
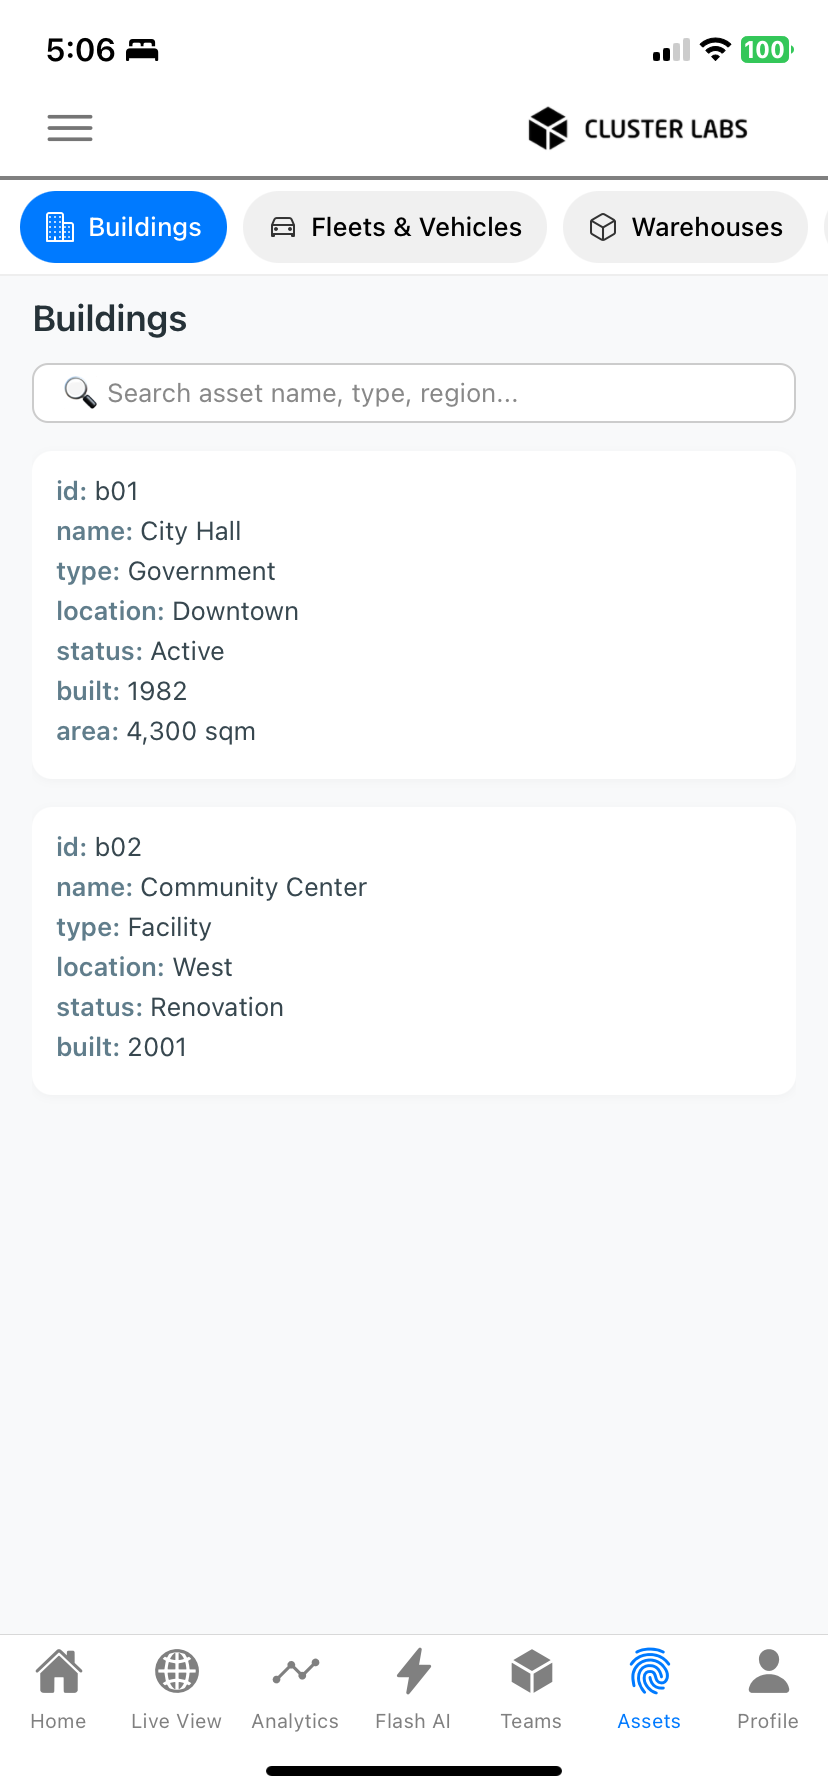
![Screenshot of a mobile app showing details of two buildings: City Hall, a government building built in 1982 with an area of 4,300 square meters, and a Community Center, a facility built in 2001 located in the west area, currently under renovation.]()
Assets
Store assets, infrastructures, track resources and status profiling
-
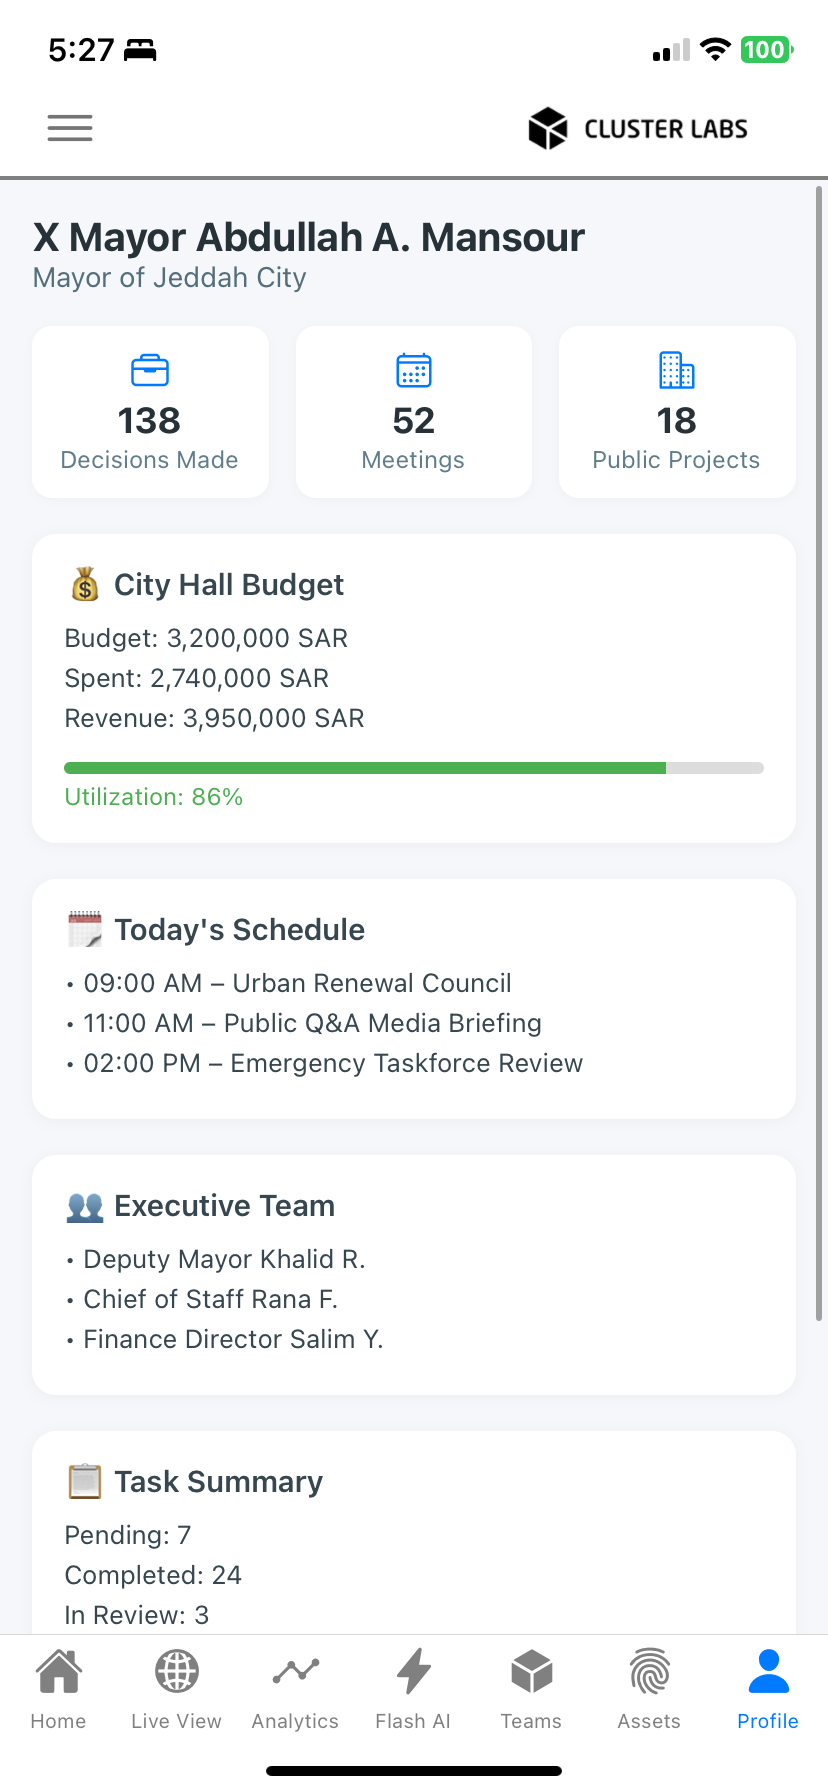
![Mobile app screen showing a profile for Mayor Abdullah A. Mansour of Jeddah City, with statistics on decisions made, meetings, public projects, city hall budget and utilization, today's schedule, executive team, and task summary, with mobile network, Wi-Fi, and battery icons at the top.]()
Profile Page
Overlook user tasks, performance and institiution analytics.
“City Map turns complex, siloed, multi-stakeholder environments into living systems - mapped, measured, automated, streamlined, and understood.”
- Cluster Labs
Core Capabilities
-
![Close-up of a colorful splash of various fibers, beads, and small black and gold decorative items in motion.]()
Built-in Analytics Engine
Generates instant insights, predictions, risk alerts, actionable tasks and visual reports.
-
![A detailed, intricate circuit board with multiple interconnected pathways and small rectangular components.]()
Operational Automation
From insights to workflows. Tasks auto-generated, assigned, tracked, and closed.
-
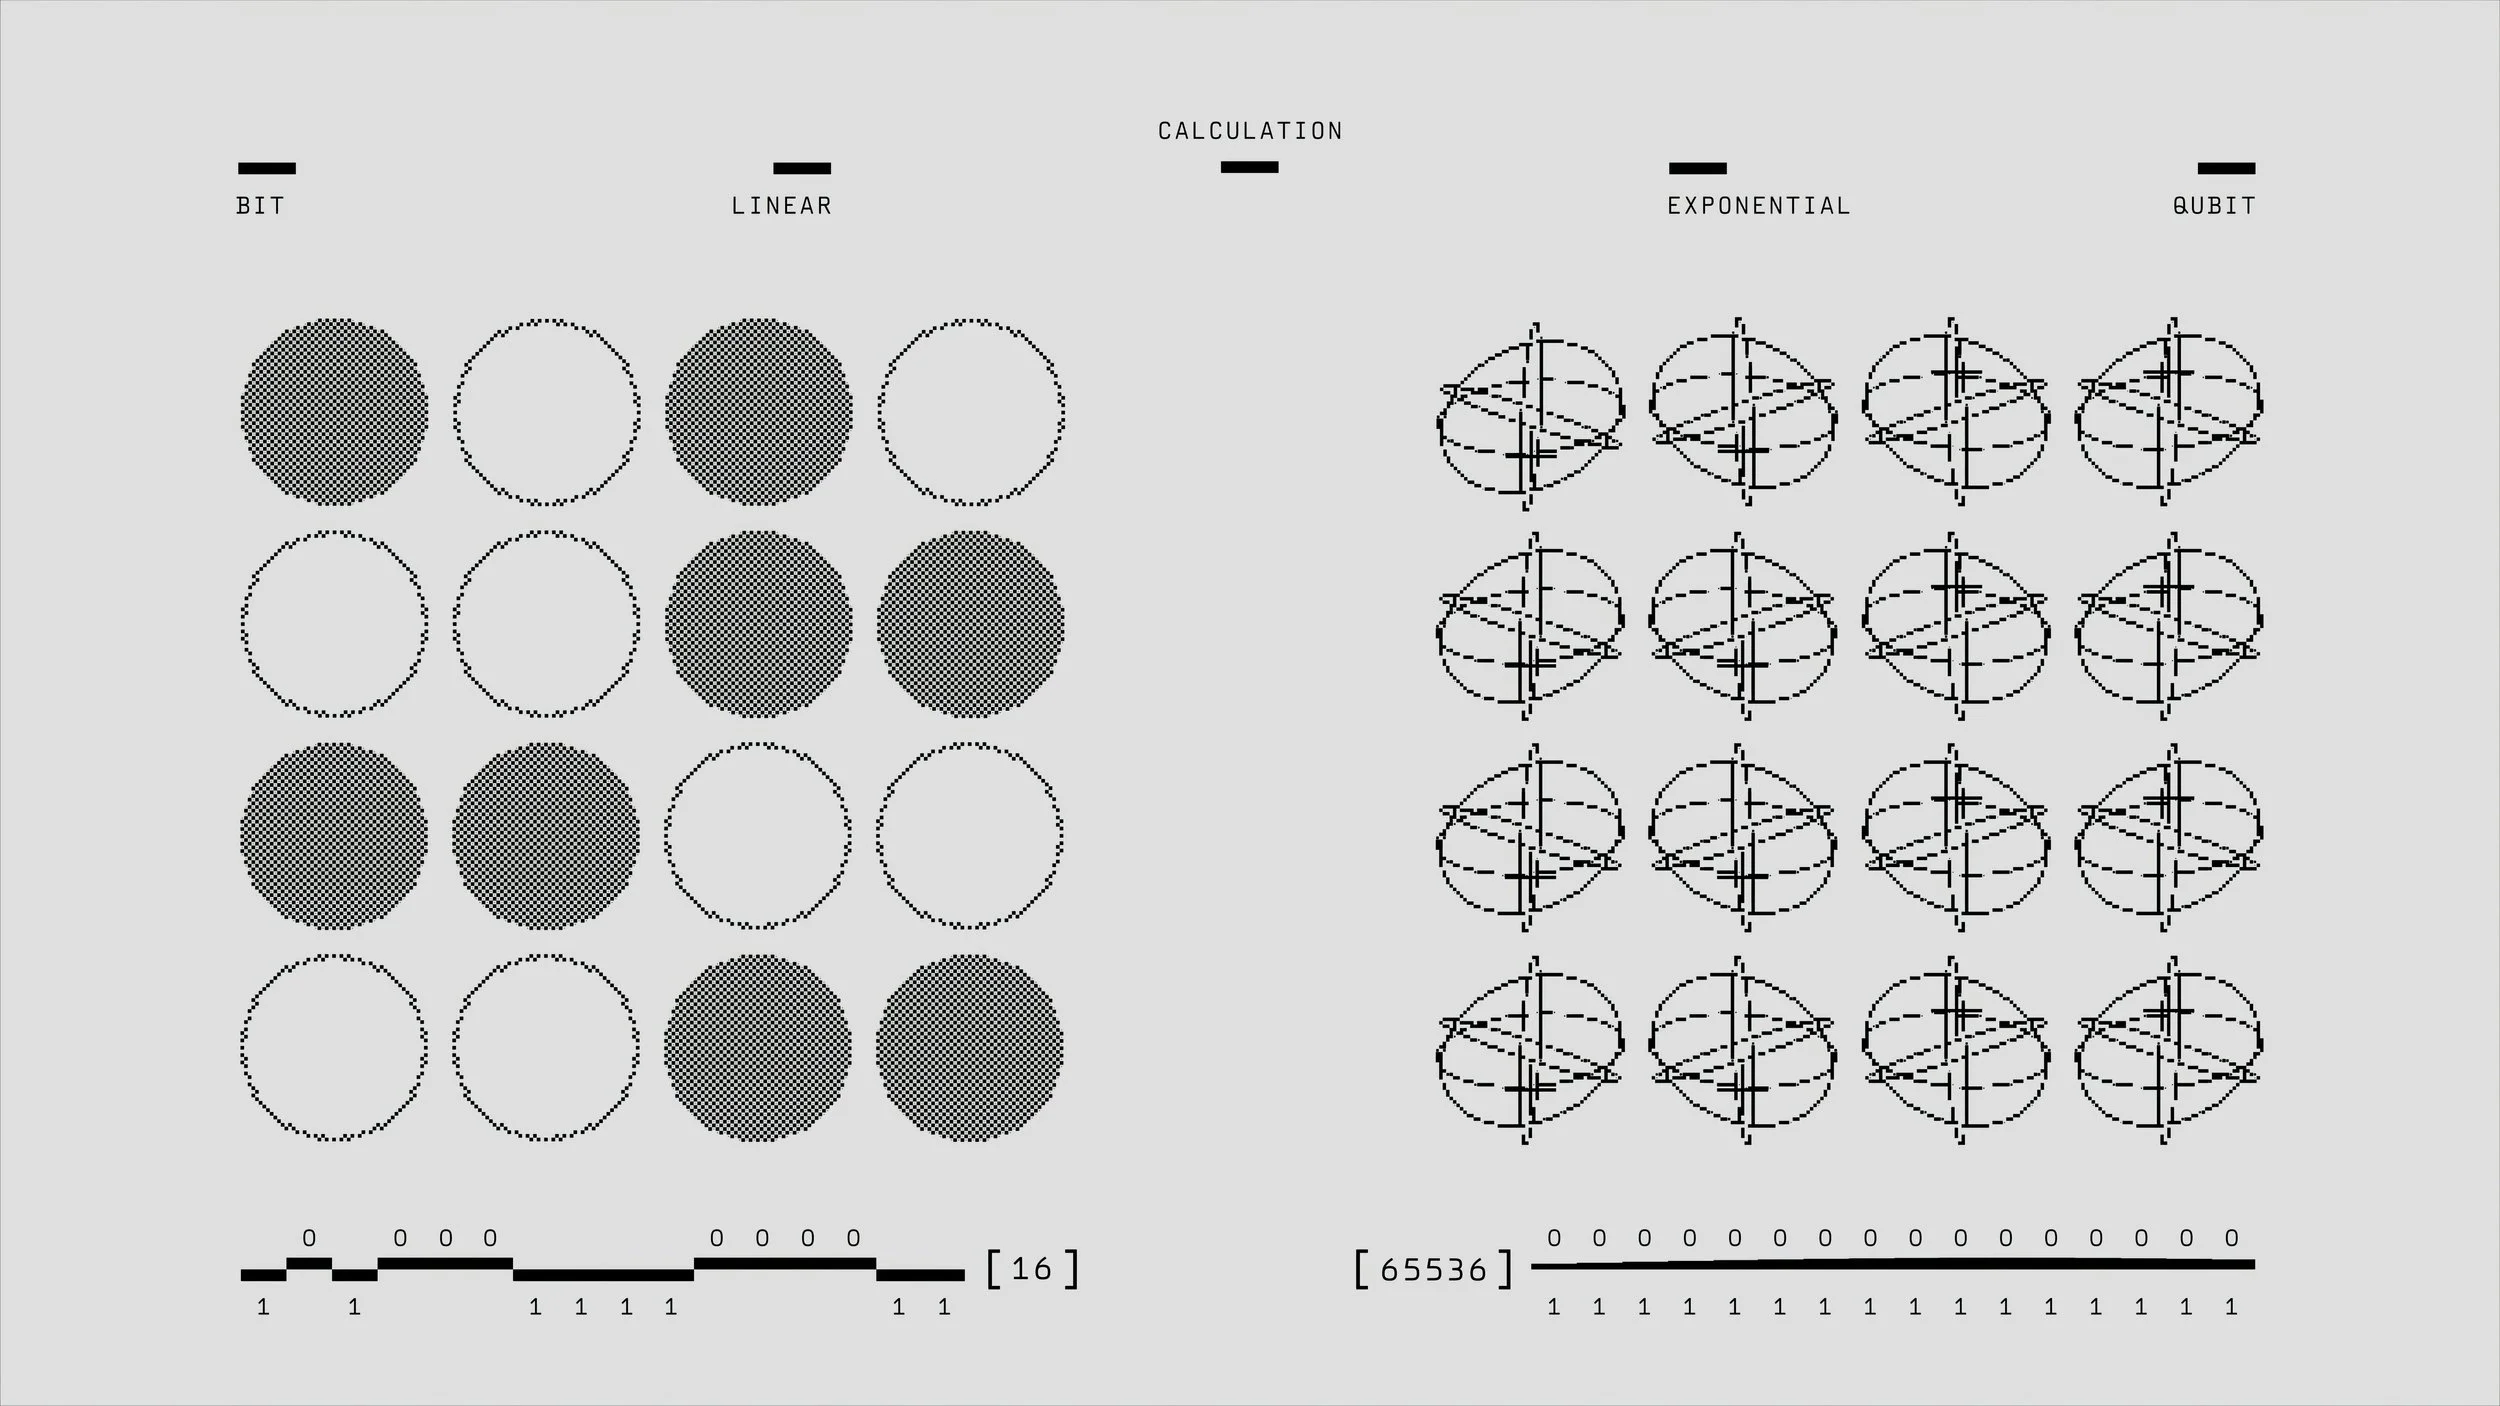
![A diagram showing different binary representations and conversions to linear, exponential, and qubit models, including circles with various shading and dotted outlines, and numbering from 0 to 1 with labeled sections.]()
Live Spatial + 3D Digital Twin
Realtime overview for zoning, utilities, climate, stakeholders and asset overlays.
-
![A collection of abstract 3D shapes in various colors and sizes, arranged in a grid pattern on a gray background.]()
Field-Ready Data Collection
Mobile LiDAR, photogrammetry, geo-referenced actions, forms, complaints, surveys.
-
![A grid of 15 abstract, colorful glass sculptures on a light background, each with unique shapes and textures.]()
Multi-Stakeholder Portals
Custom portals for teams, departments, firms, citizens, and researchers.
-
![Colorful plastic rings and square-shaped objects hanging from the ceiling, illuminated with vibrant lighting.]()
Historical Intelligence Archive
Tracks city events, field teams activity, asset logs, and site changes over time.
-
![Model train tracks with curves and barriers, set up on a surface with scattered wooden pieces and blocks.]()
Automated Risk Detection
Climate triggers, resource warnings, geological and environmental alerts, public force majeure situations.
-
![A digital 3D art composition featuring a transparent cube with iridescent surfaces, filled with lush green trees and foliage, set against a muted green background.]()
Built for Collaboration
One environment connecting teams, departments, cities, institutions, and communities with purpose.
-
![A digital illustration of colorful molecular structures floating in a dark space.]()
Friendly Integrations
Open API & data formats for maximum compatibility with existing systems, databases, IoT sensors & field tools.


City Map in Action
Explore how City Map tackles complex challenges, connects ecosystems, and delivers tools tailored for real-world users. Click any section below to dive deeper into the platform’s logic, integrations, and unique value.

-
From GIS to Action Engine - Beyond maps: real-time automation, analytics, reporting, and predictive logic.
Multidisciplinary by Design - Urban, environmental, cultural, and technical data in one frame.
Live + Archival + Predictive = Not just what’s happening - what happened, and what’s coming.
Validated in the Field - Born from real pain points, not hypothetical needs.
Effortless to Use - Plug and Play integrations, analysis, and task tools built for non-technical users.
-
Disconnected GIS / BIM CAD / ERP / IoT data systems.
Inefficient workflows & task duplication.
Inaccessible or underused archival & field data.
Difficulty generating reports or insights from big data.
Limited visibility across city assets, risks, or stakeholder input.
Lost historical context for sites, teams, or planning.
-
Urban Dashboards - zoning, permitting, field teams, public transit, infrastructure status.
Utility Views - resources, energy, pressure, flows, repairs, sensors, field staff.
Cultural Dashboards - site health, restoration, archival overlays.
Real Estate Tools - valuations, occupancy, land use, risk zones.
Rapid Reports - Generate instant visual reports for teams or presentations.
Stakeholder Collaboration - Bring engineers, citizens, and researchers into shared, role-based data environments.
Template & Preset Library - Fast setup for common use cases, designed with field experts.
-
Built-in Data Marketplace
Let stakeholders buy/sell curated datasets.Secure Data Exchange
Researchers, students, or firms can request, access, and contribute data with customisable permissions.API-Driven Integration
Sync with existing apps, data sources, collection platforms - plug & play with full interoperability.
-
Compatible with ERP platforms, CAD, GIS, and BIM systems.
Links with IoT sensors, CCTVs, environmental monitors, and city databases.
Open API for integrating with existing mobile apps, field tools, and reporting systems.
Supports all major file formats and automatically georeferences incoming data.
