CityAtlas
One Platform. Every Stakeholder. All Your Data.
Real-time analytics & AI-powered workflows.
Built for Intelligence.
Engineered for Ease.
Ready for Action.
CityAtlas turns urban data into live, actionable intelligence.
It pulls every dataset into one platform, syncs your team, and auto-generates insights; so planners, utilities, heritage custodians, asset managers, and property pros see the full picture in real time.
Prioritising Optimisation & Automation
CityAtlas gives you live visibility of every asset and automates the workflows around them, so your team acts faster and works smarter.
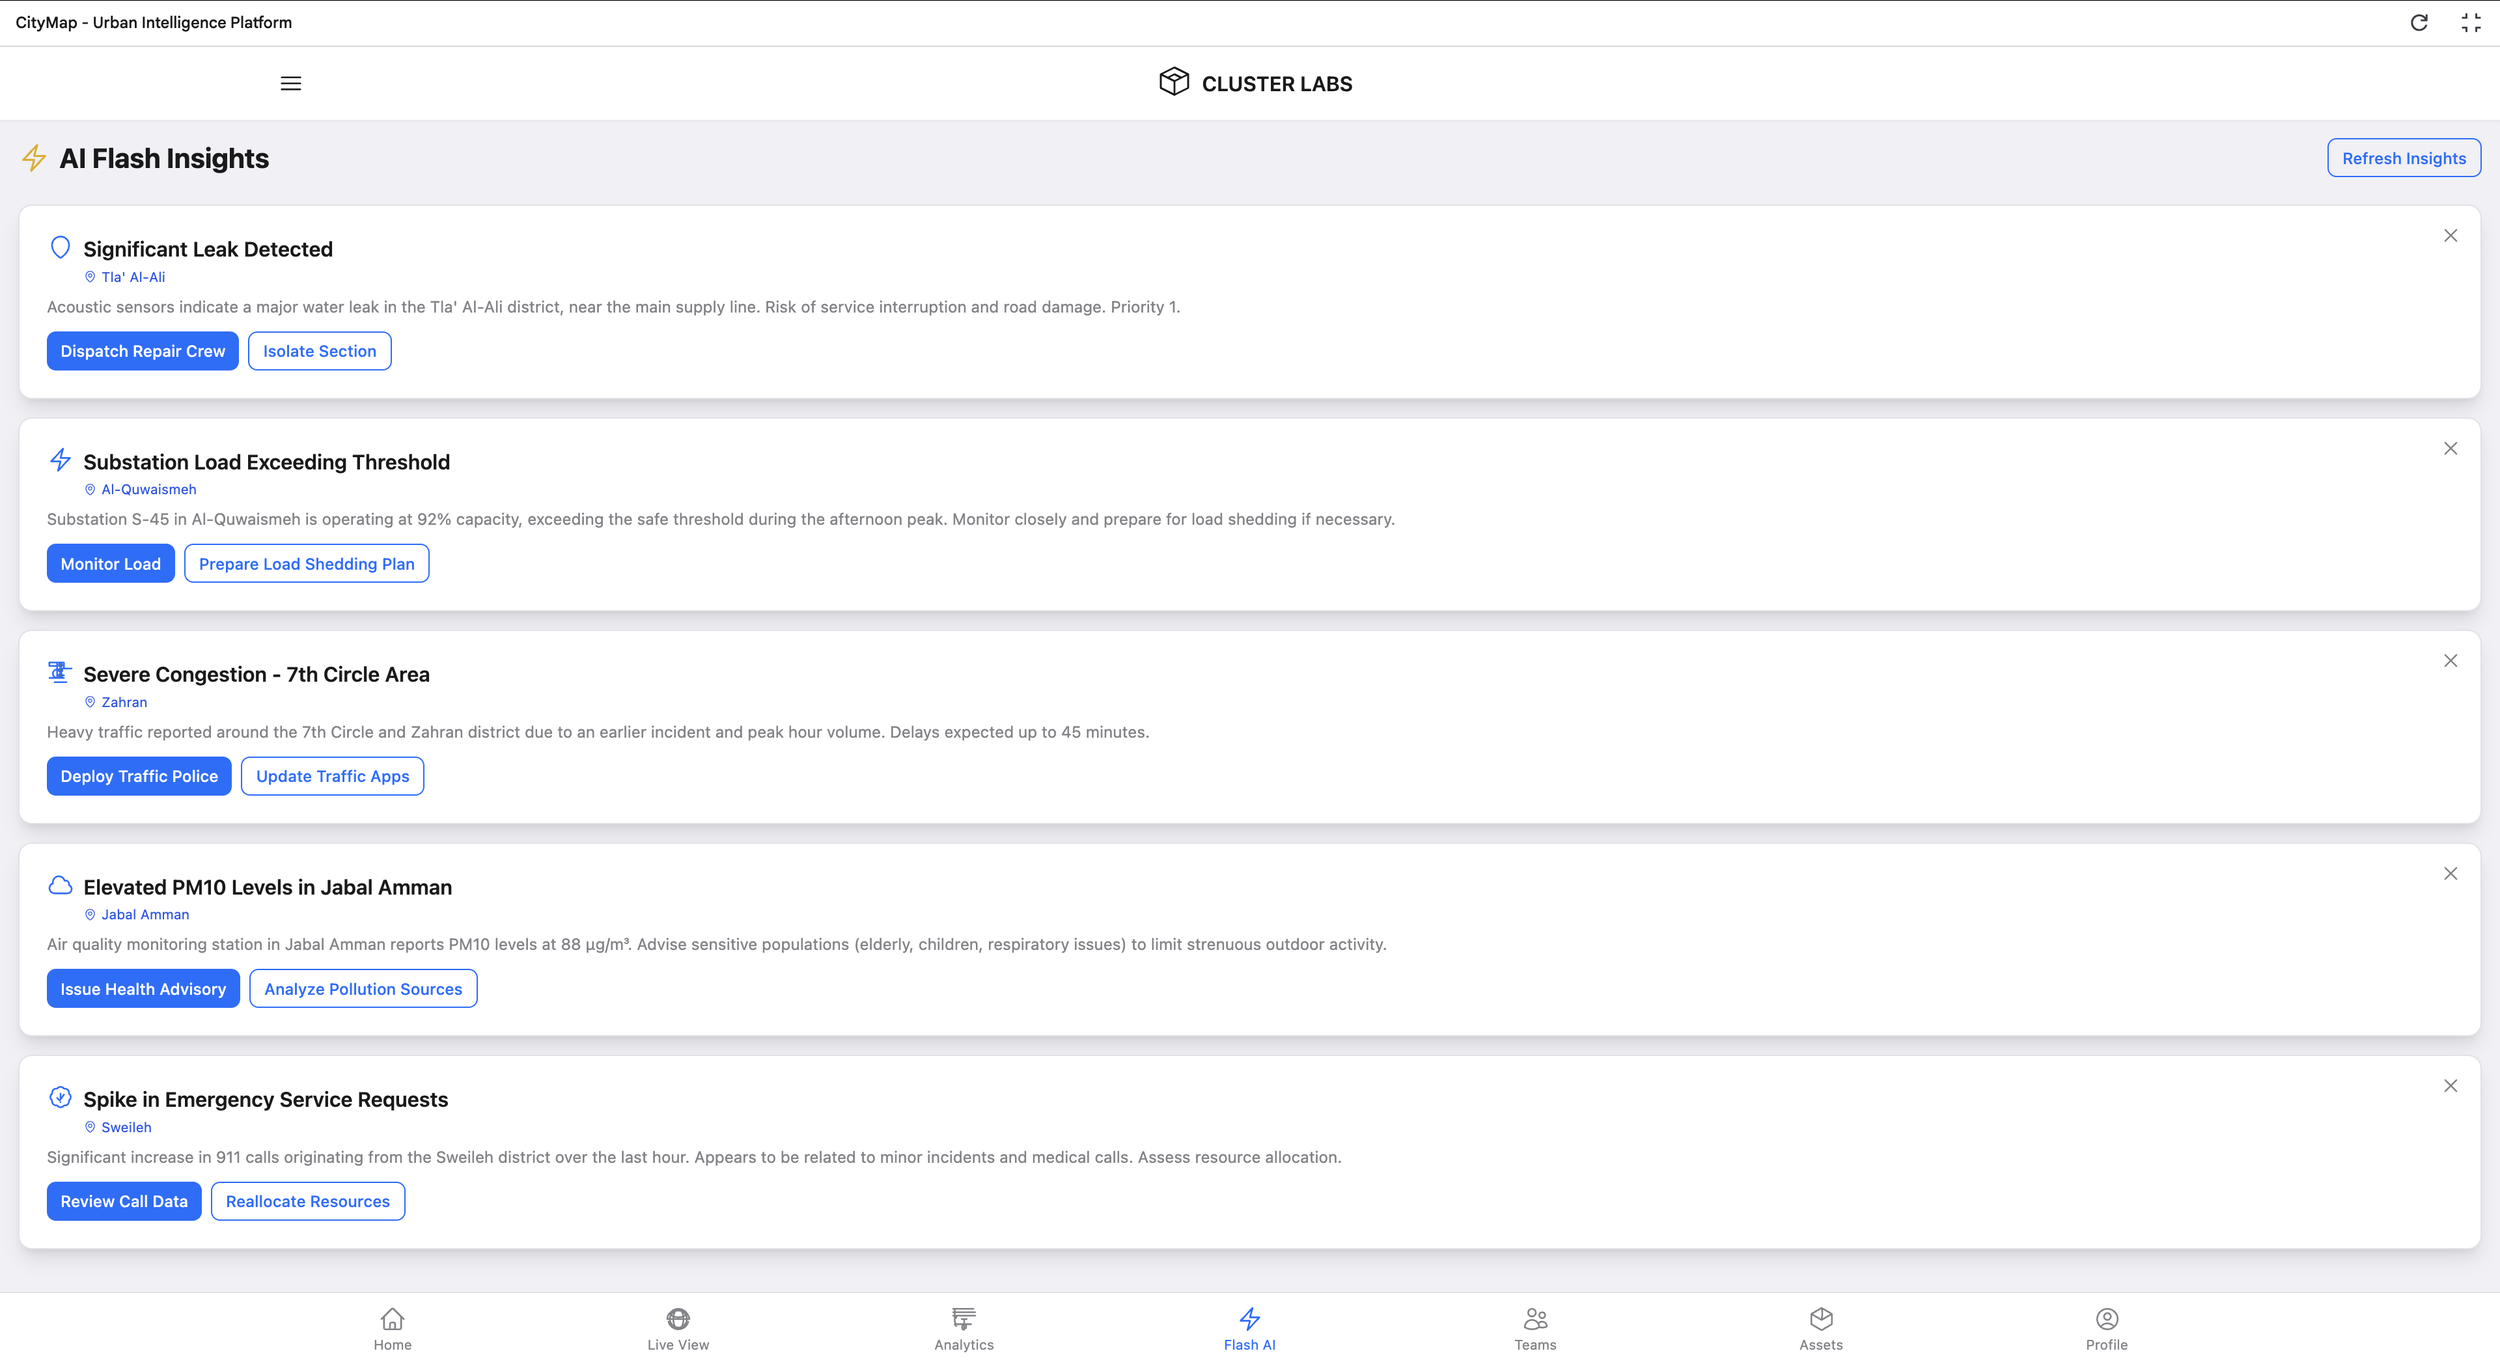
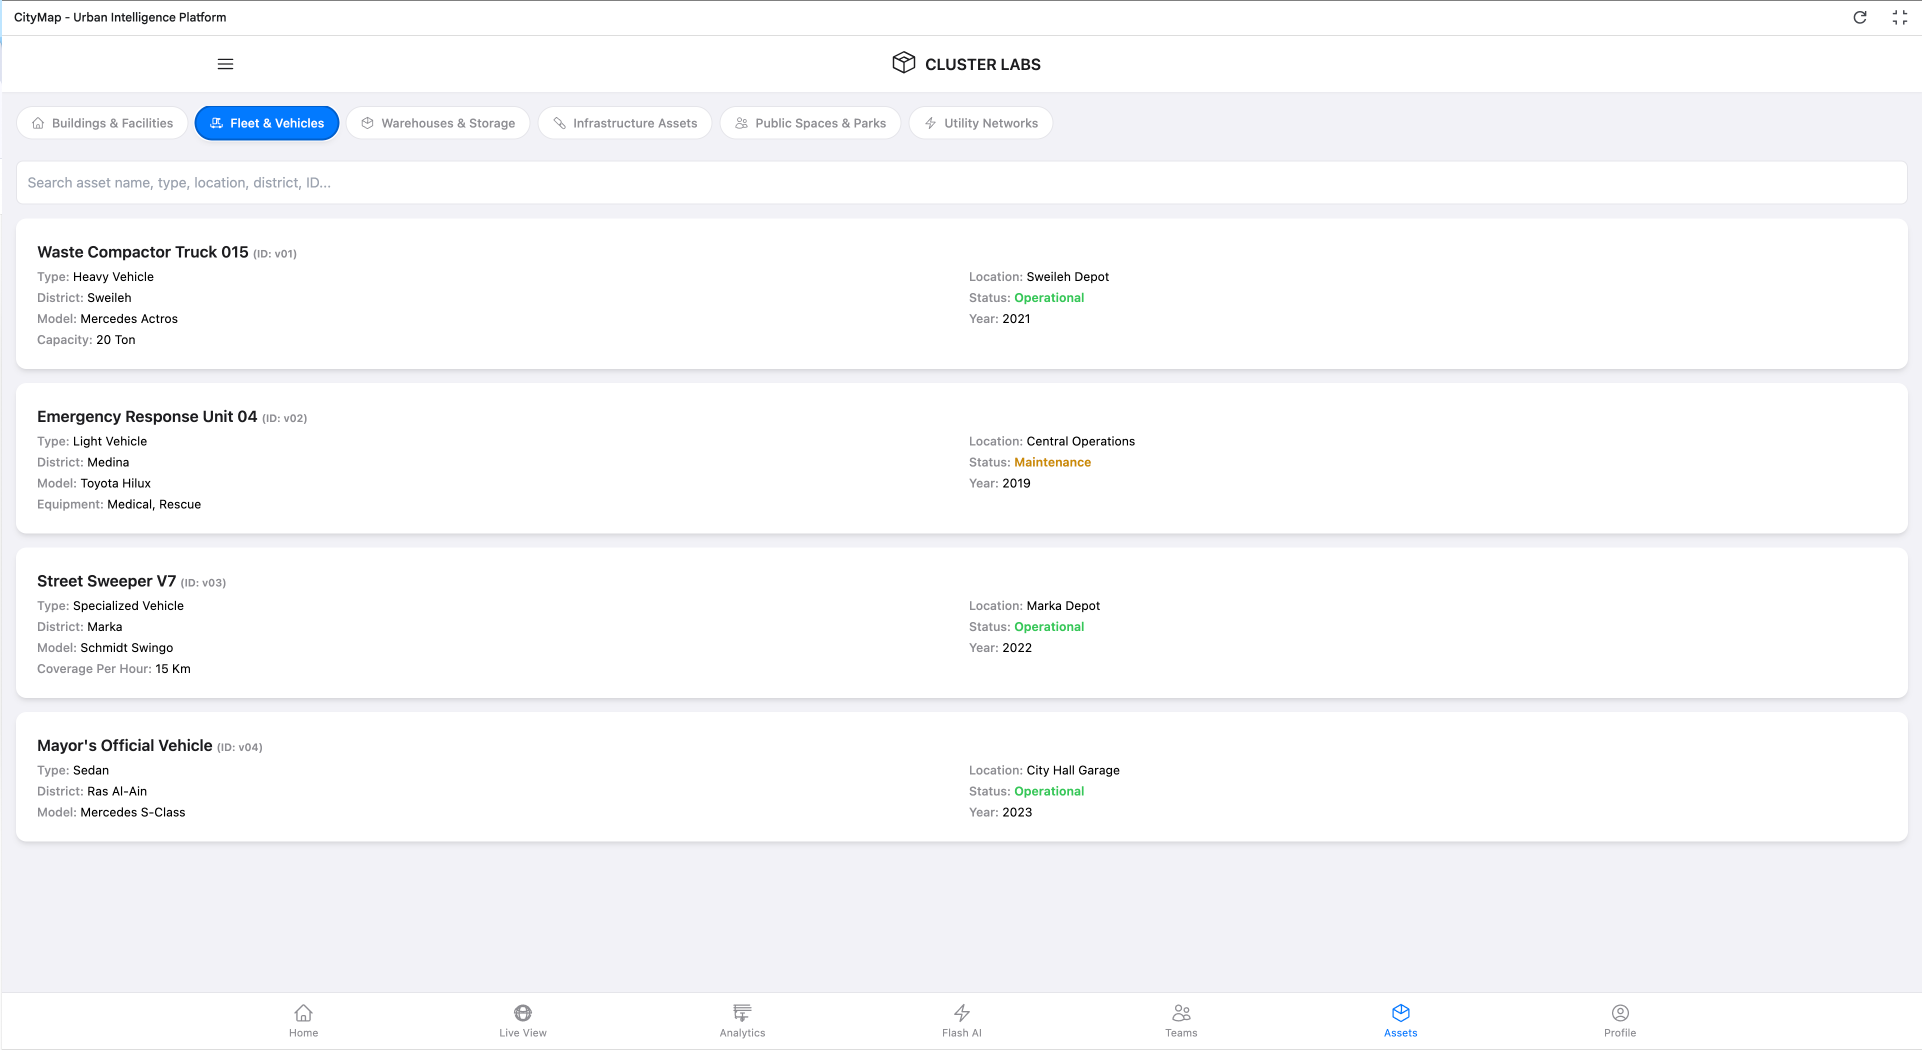
Interface Demo - PC (Beta)
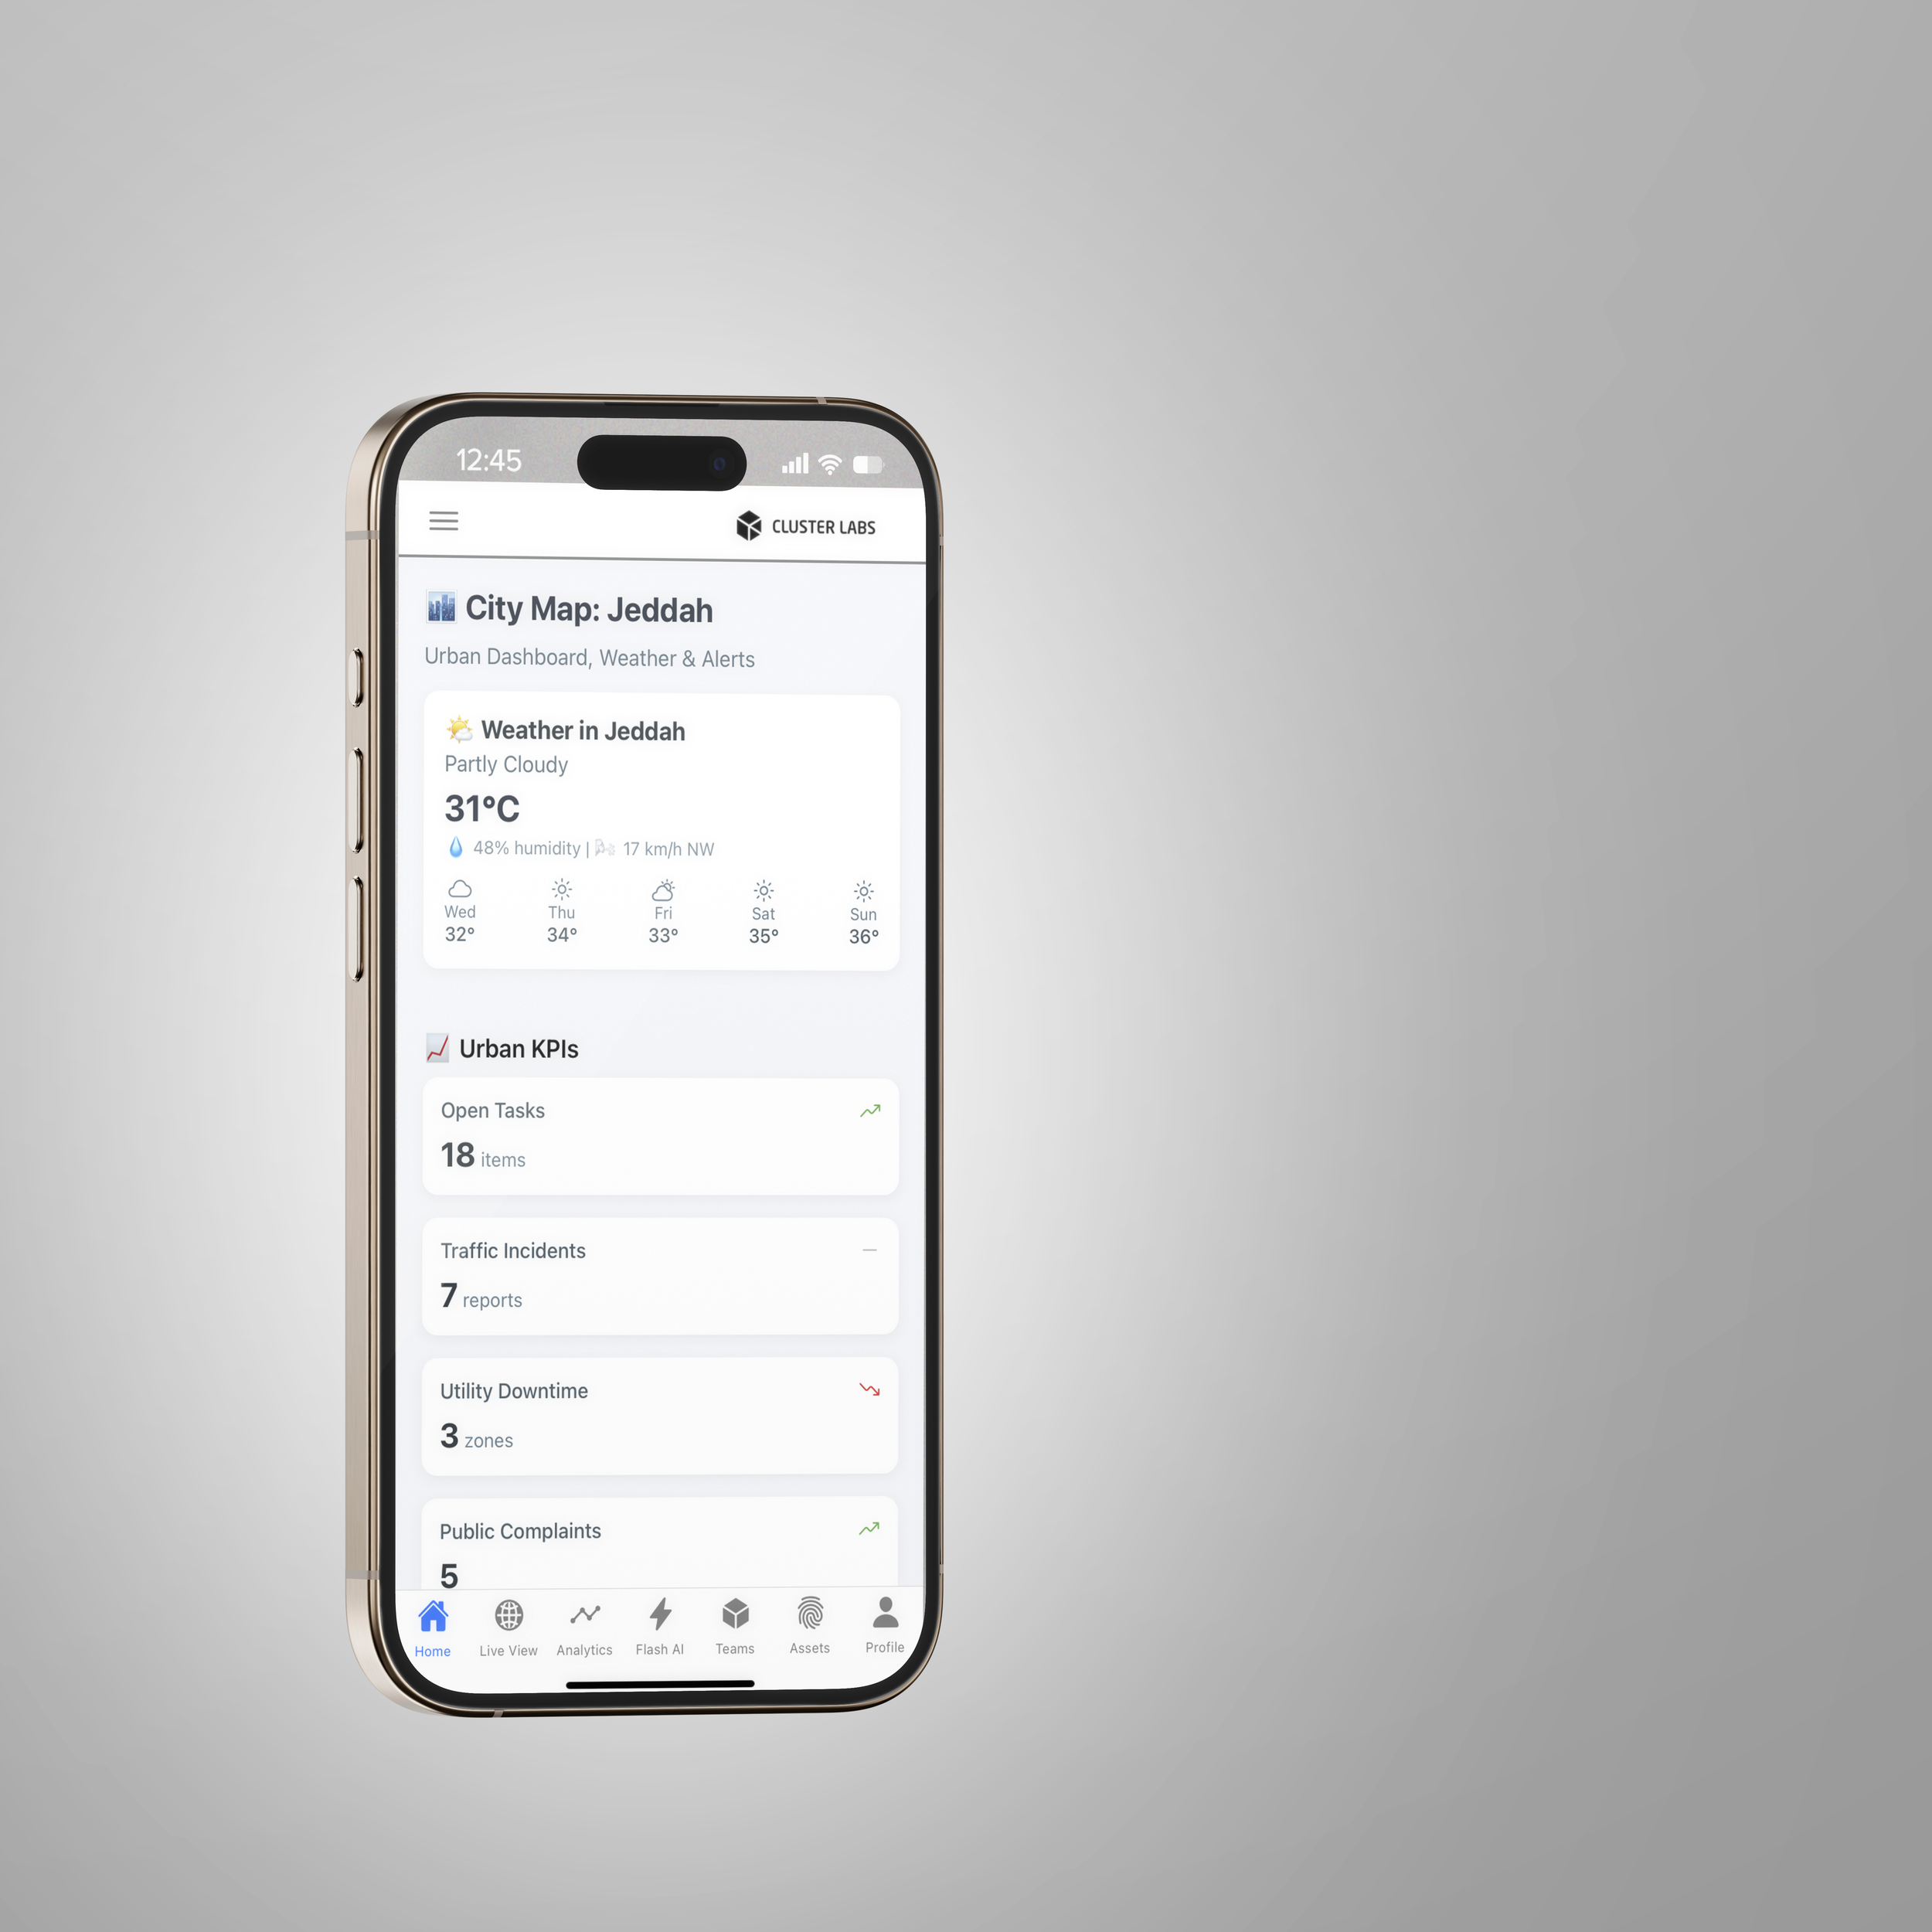
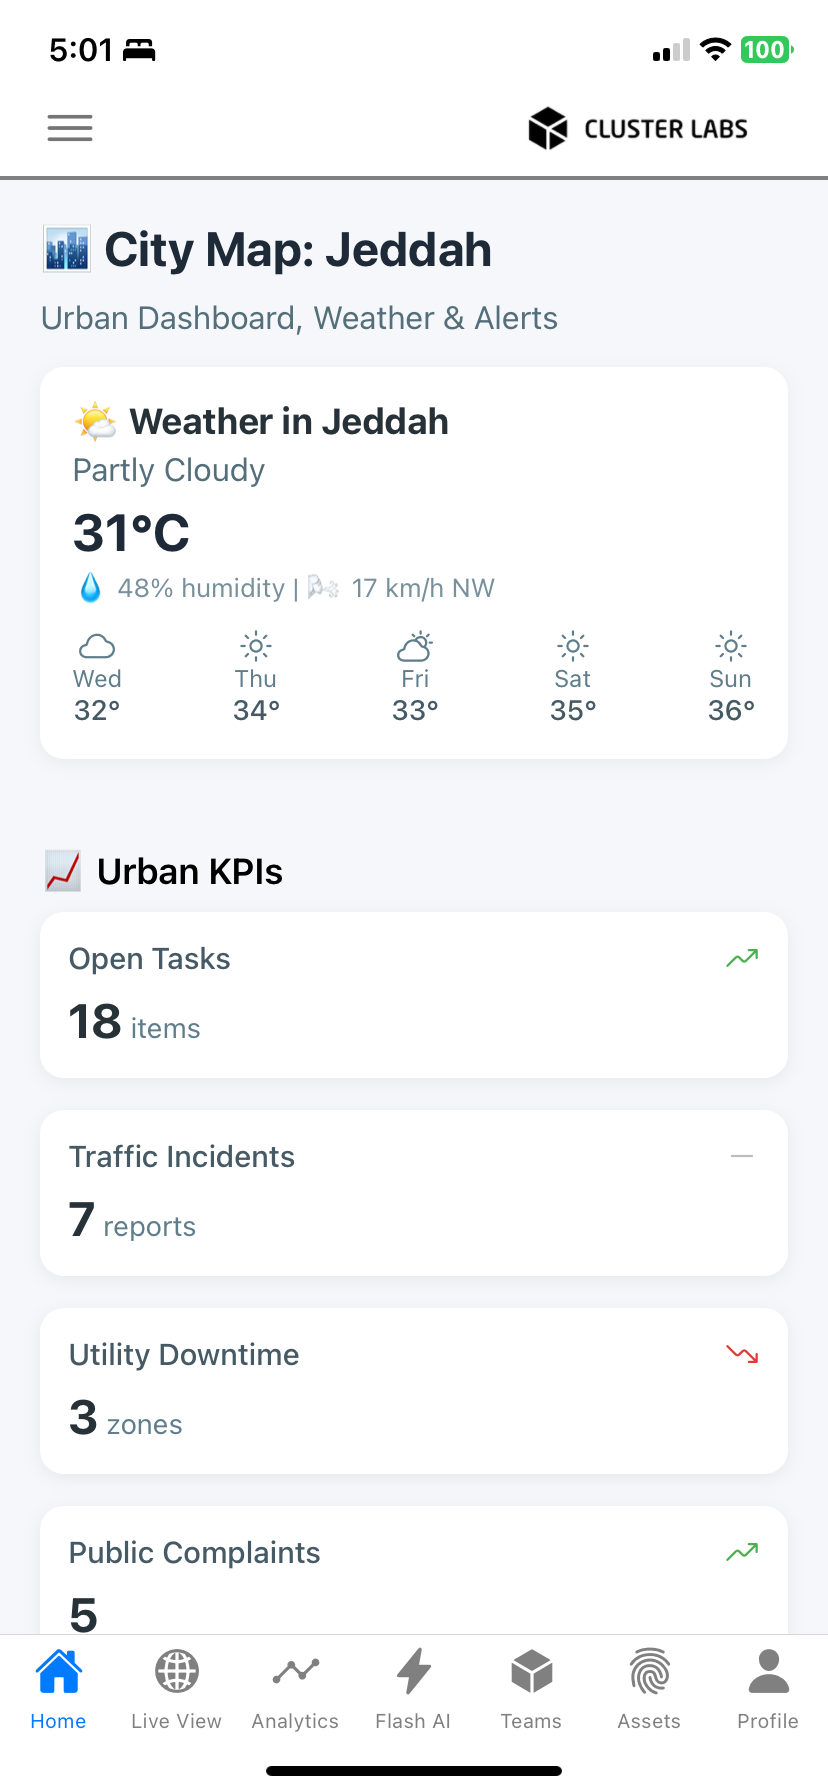
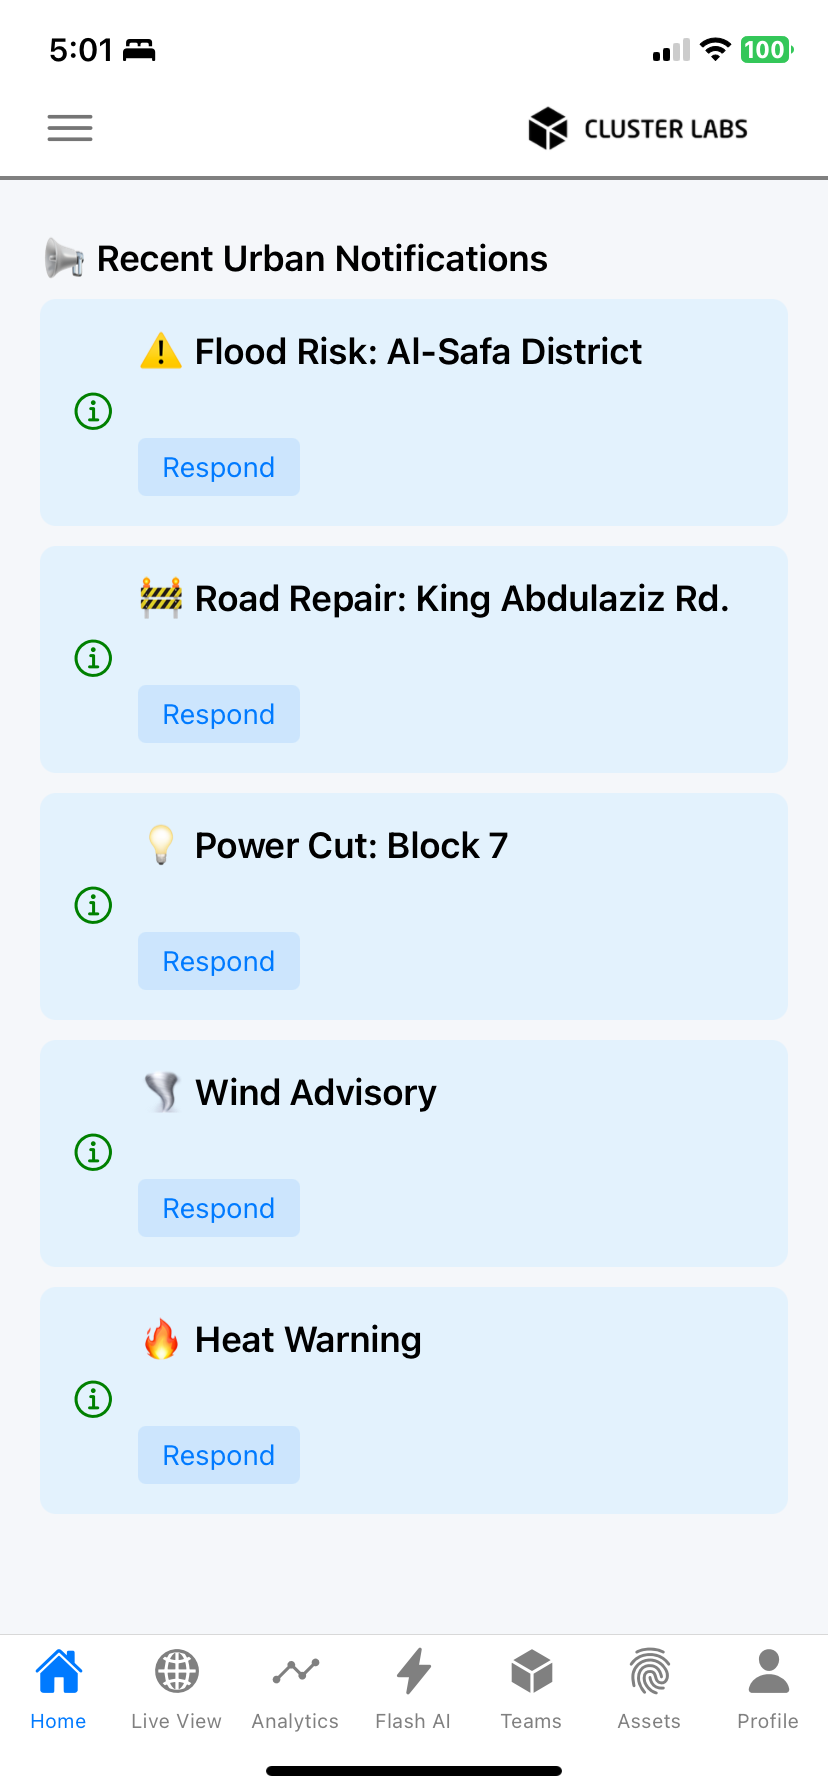
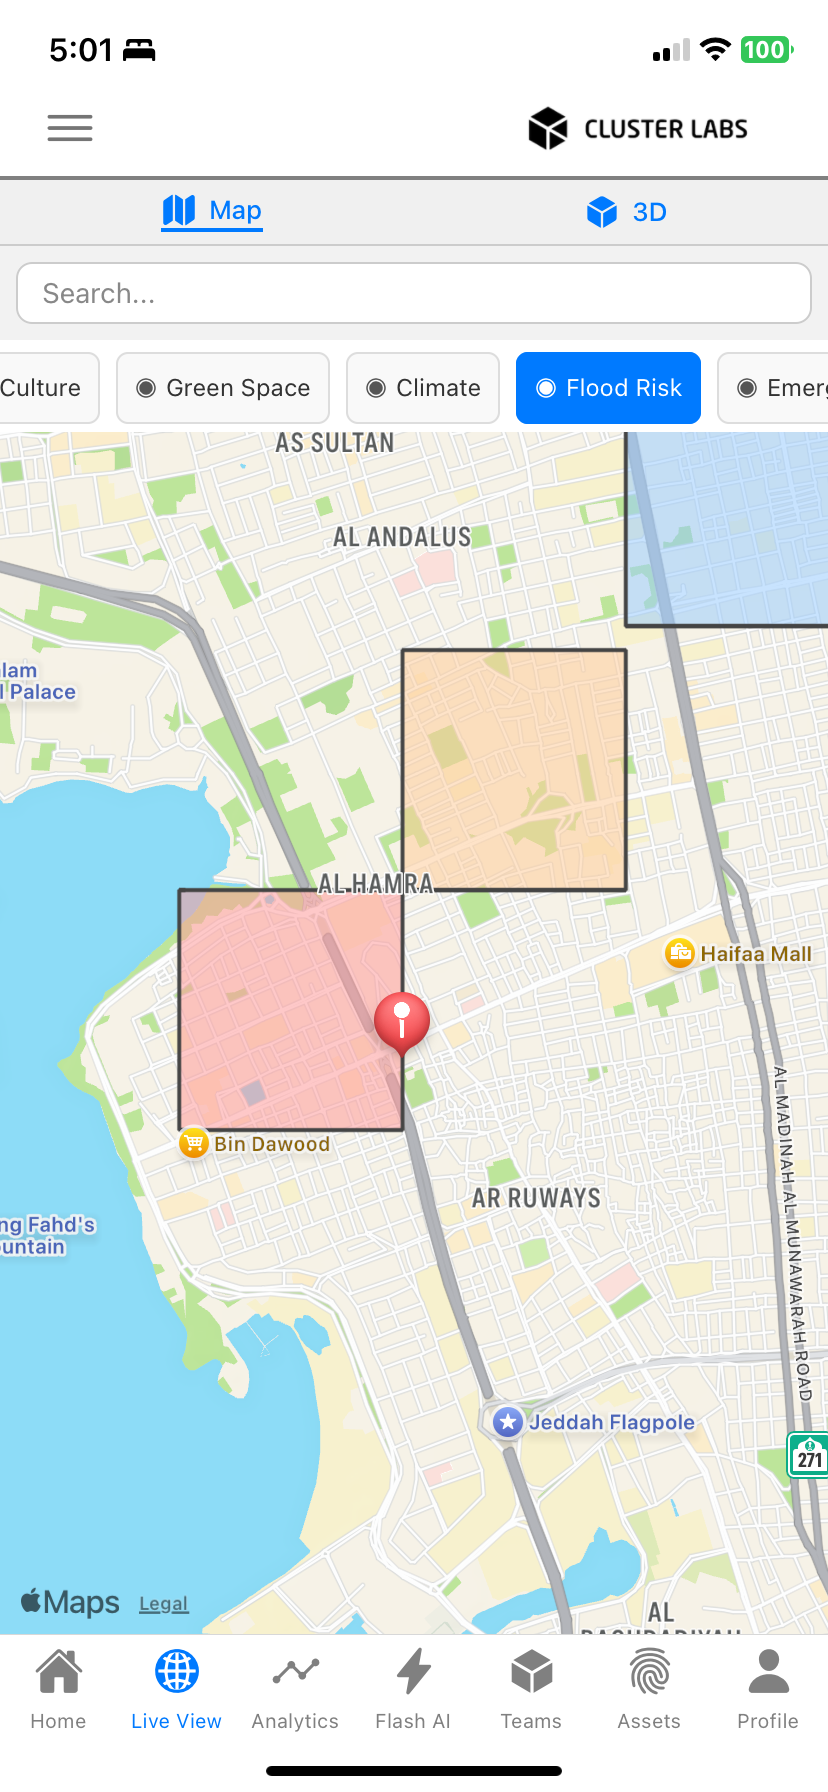
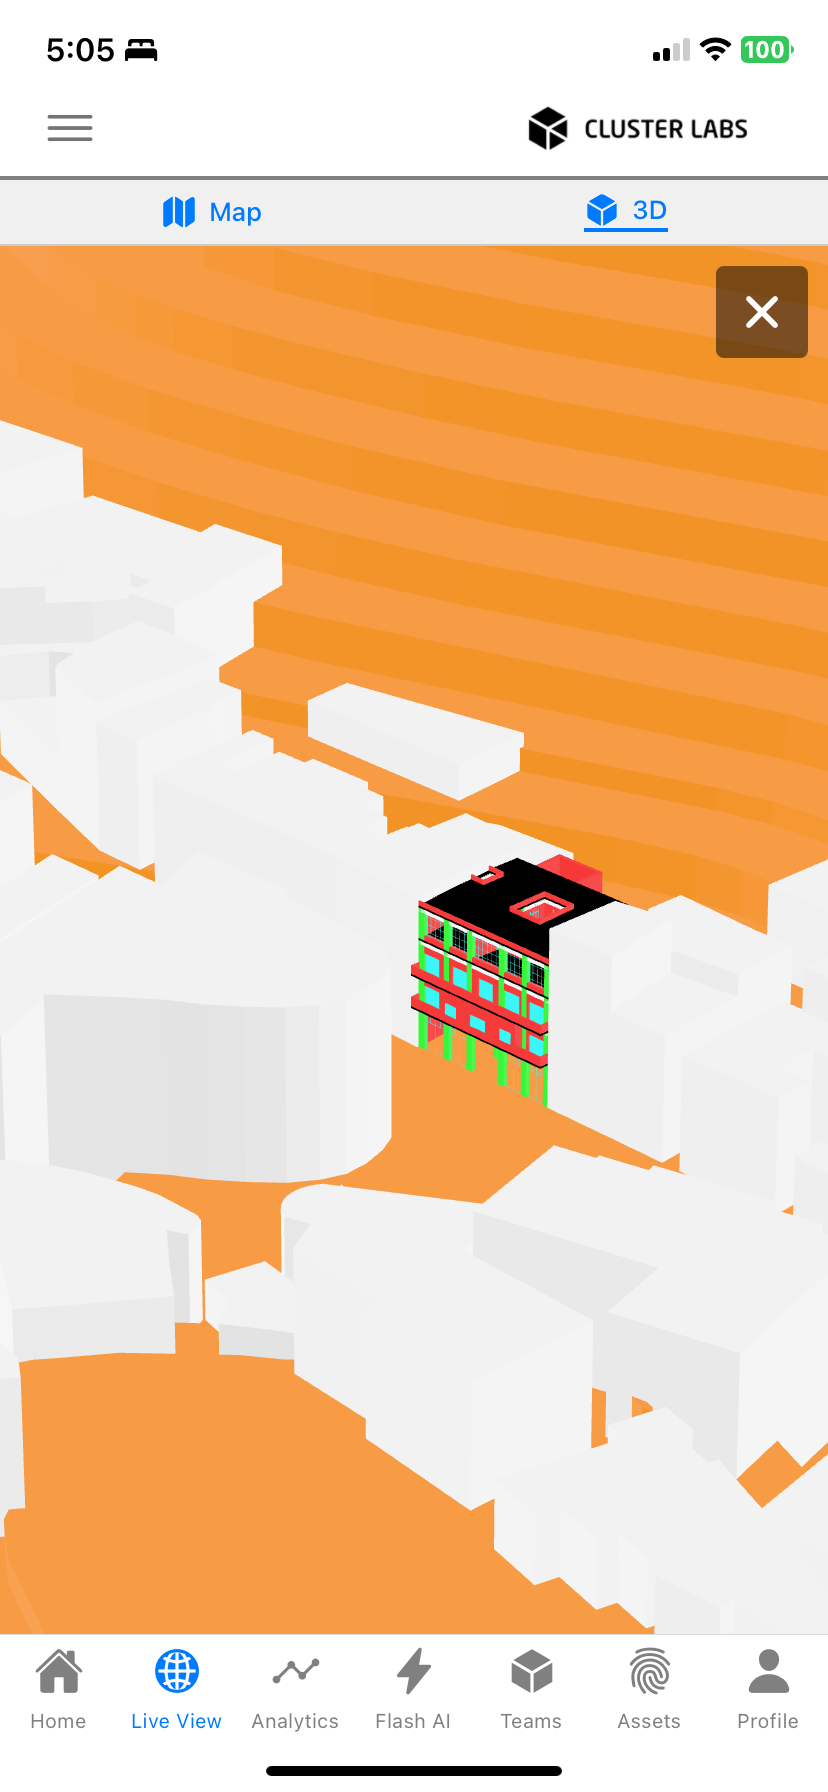
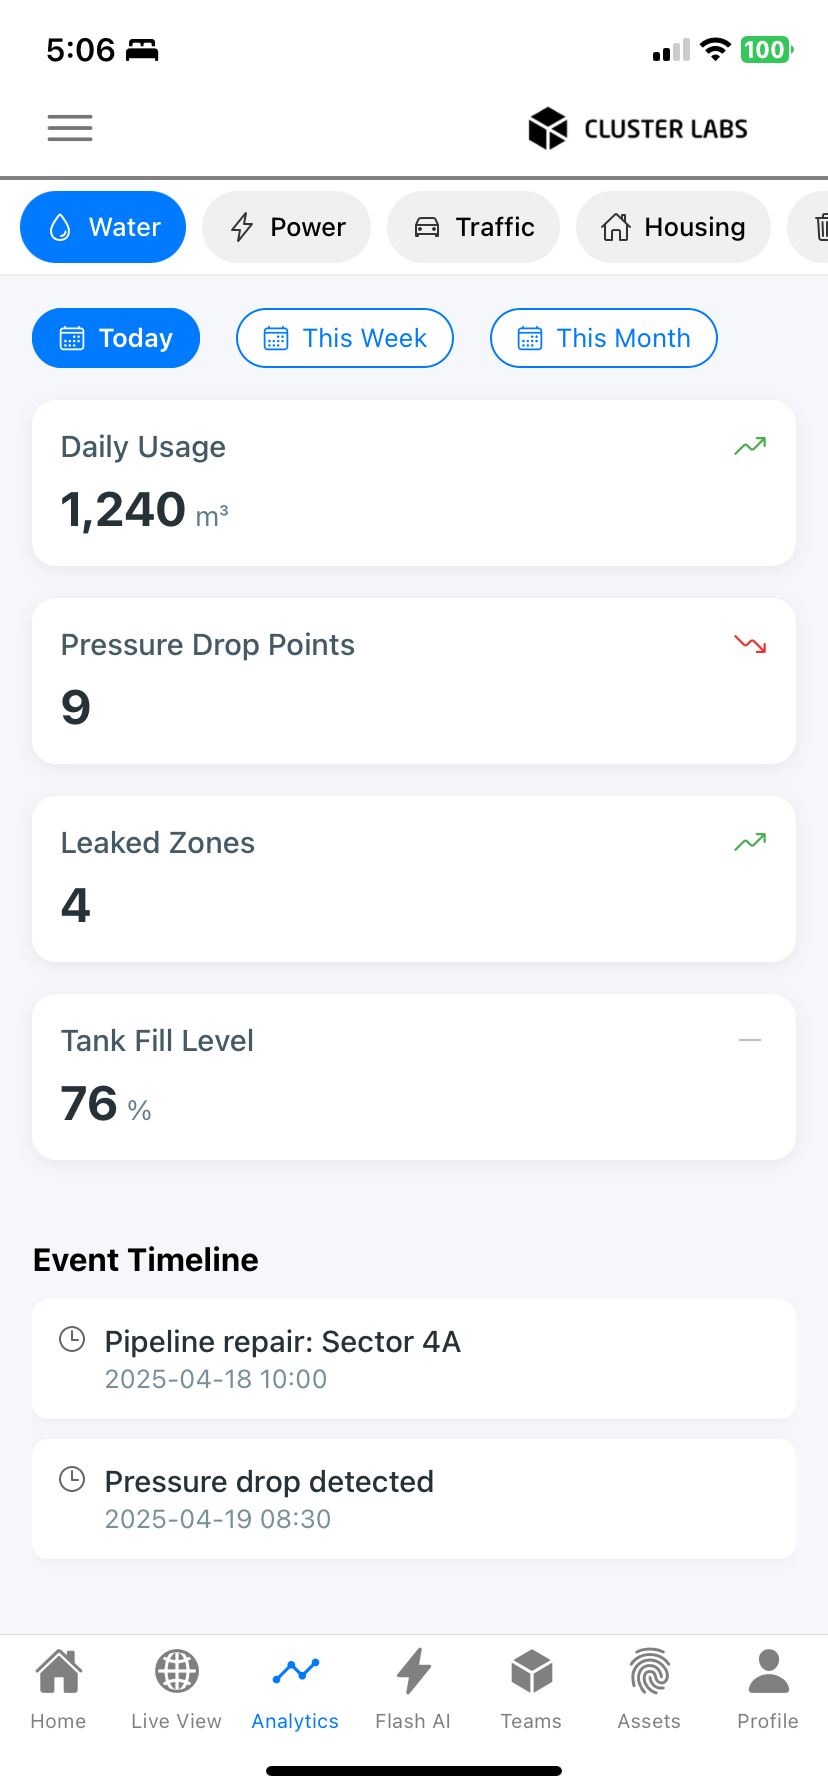
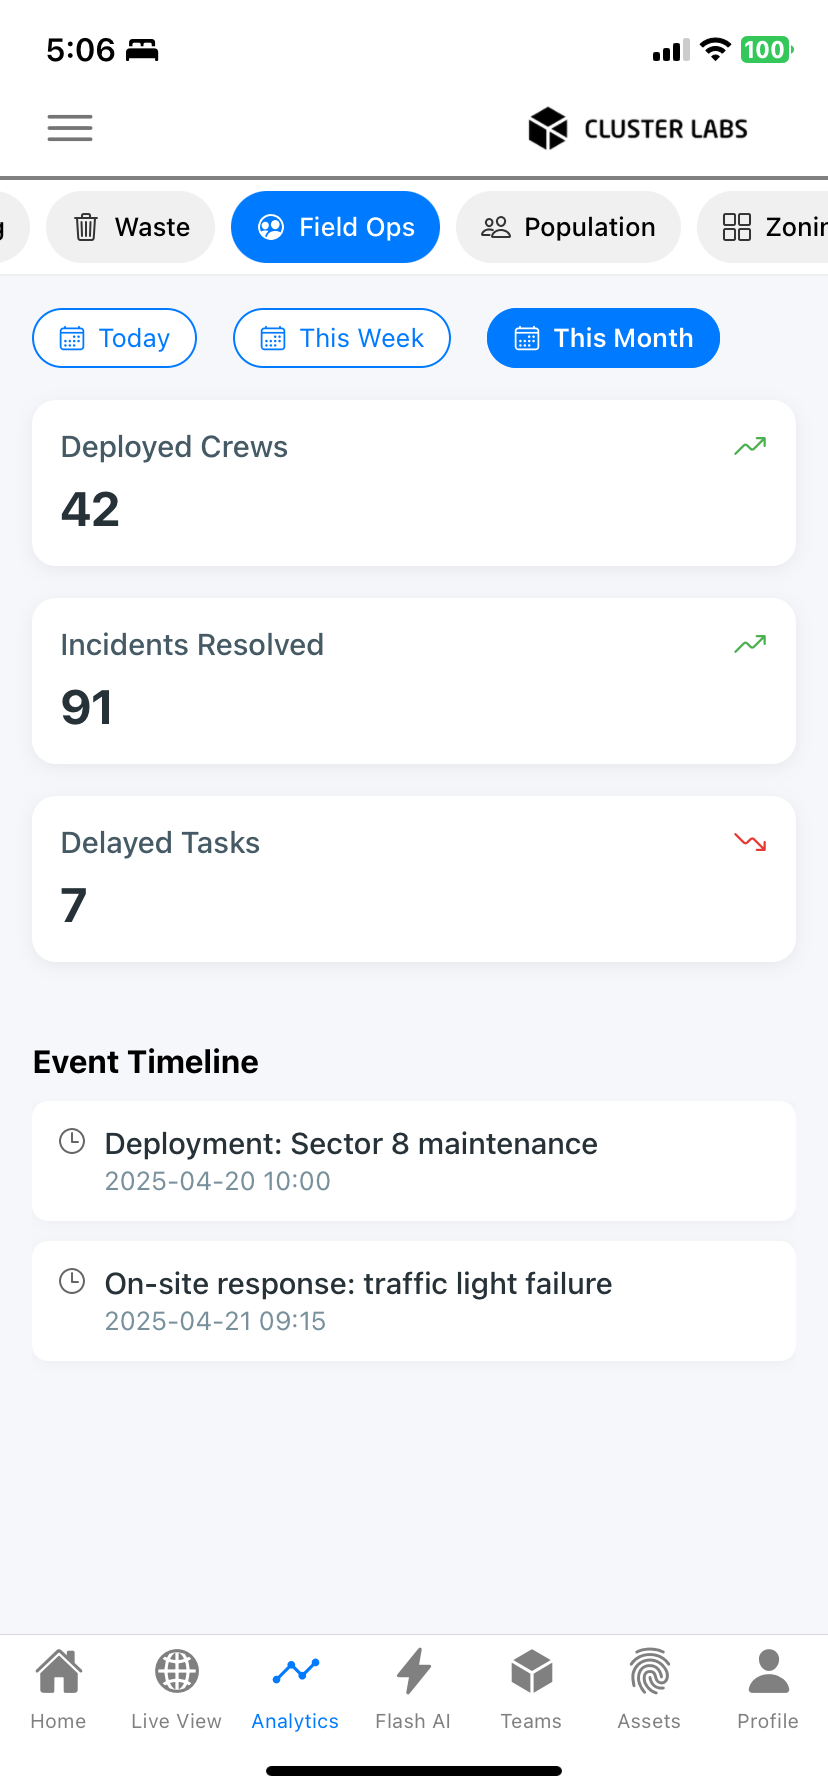
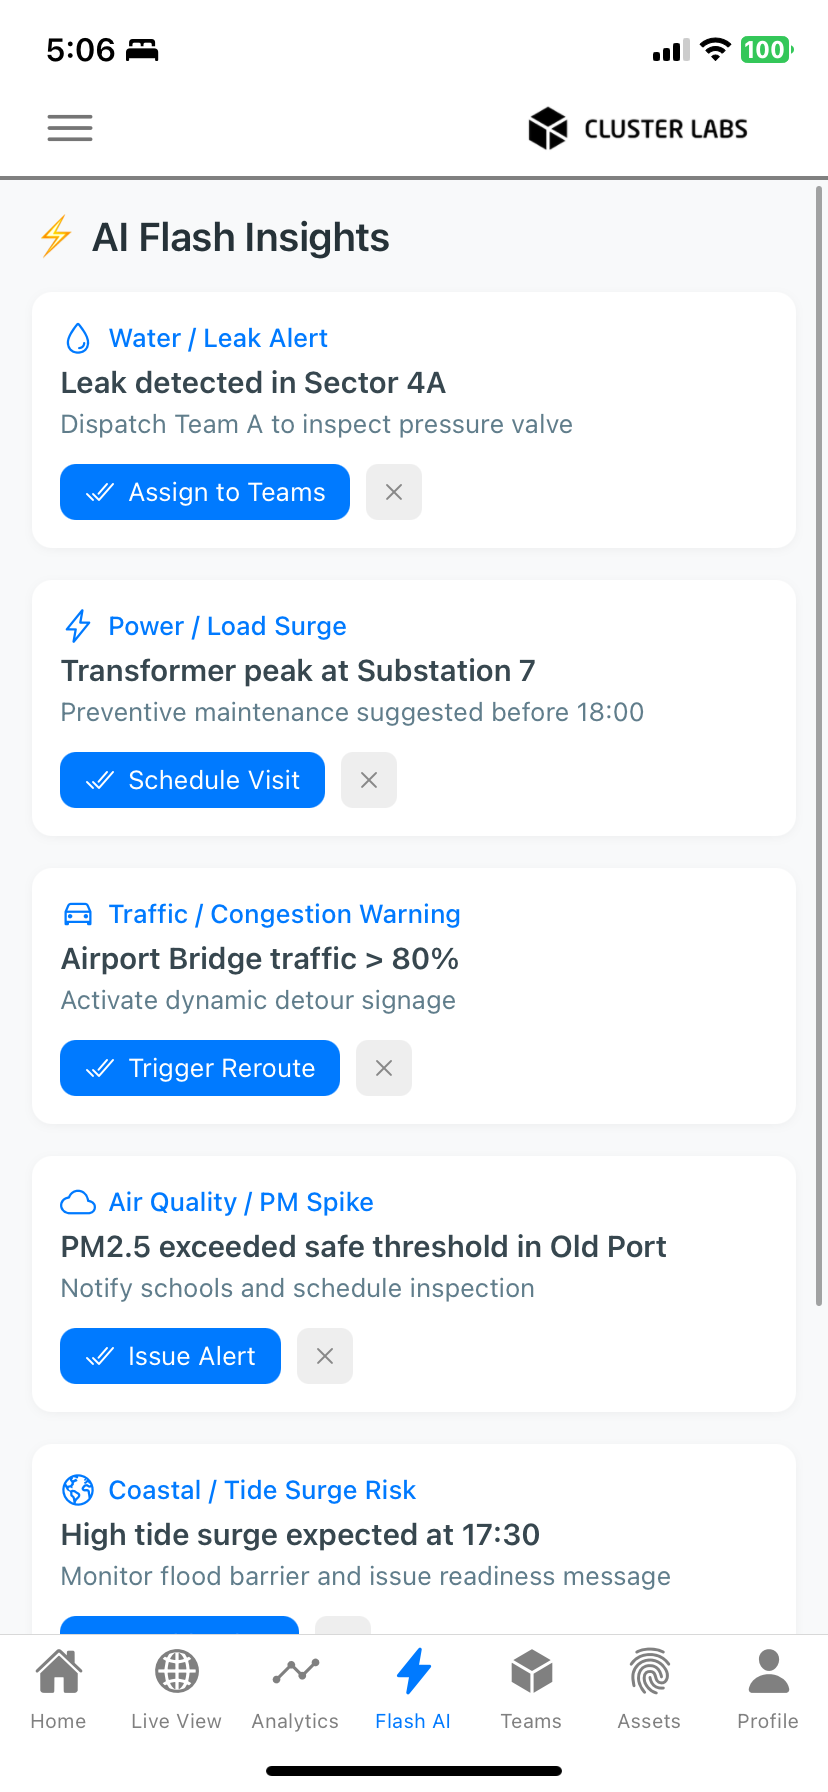
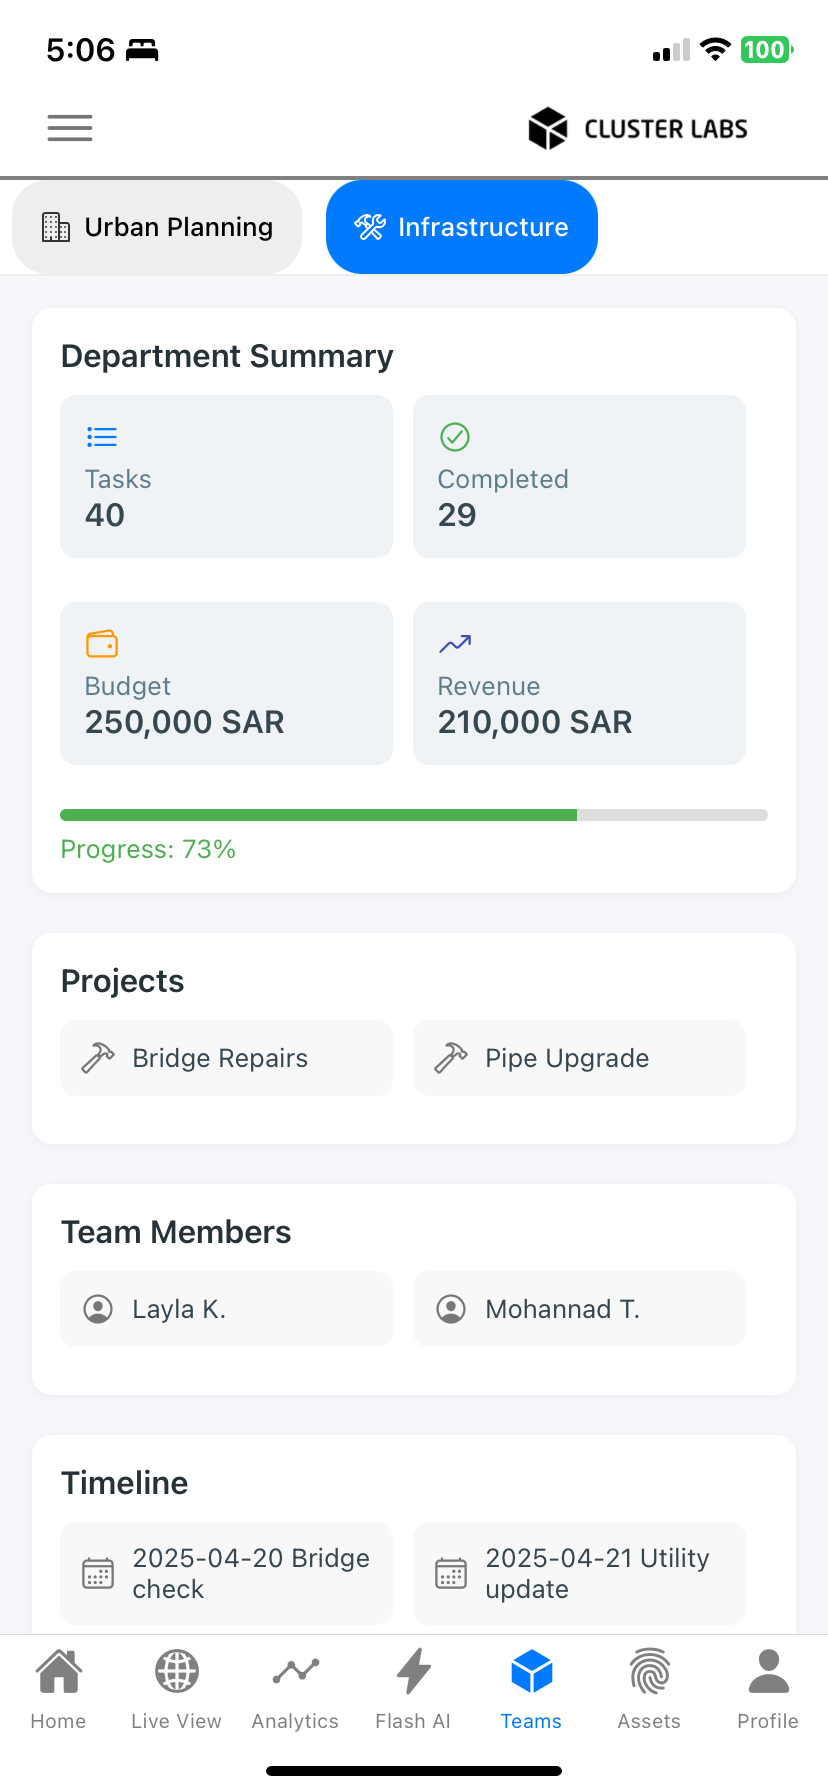
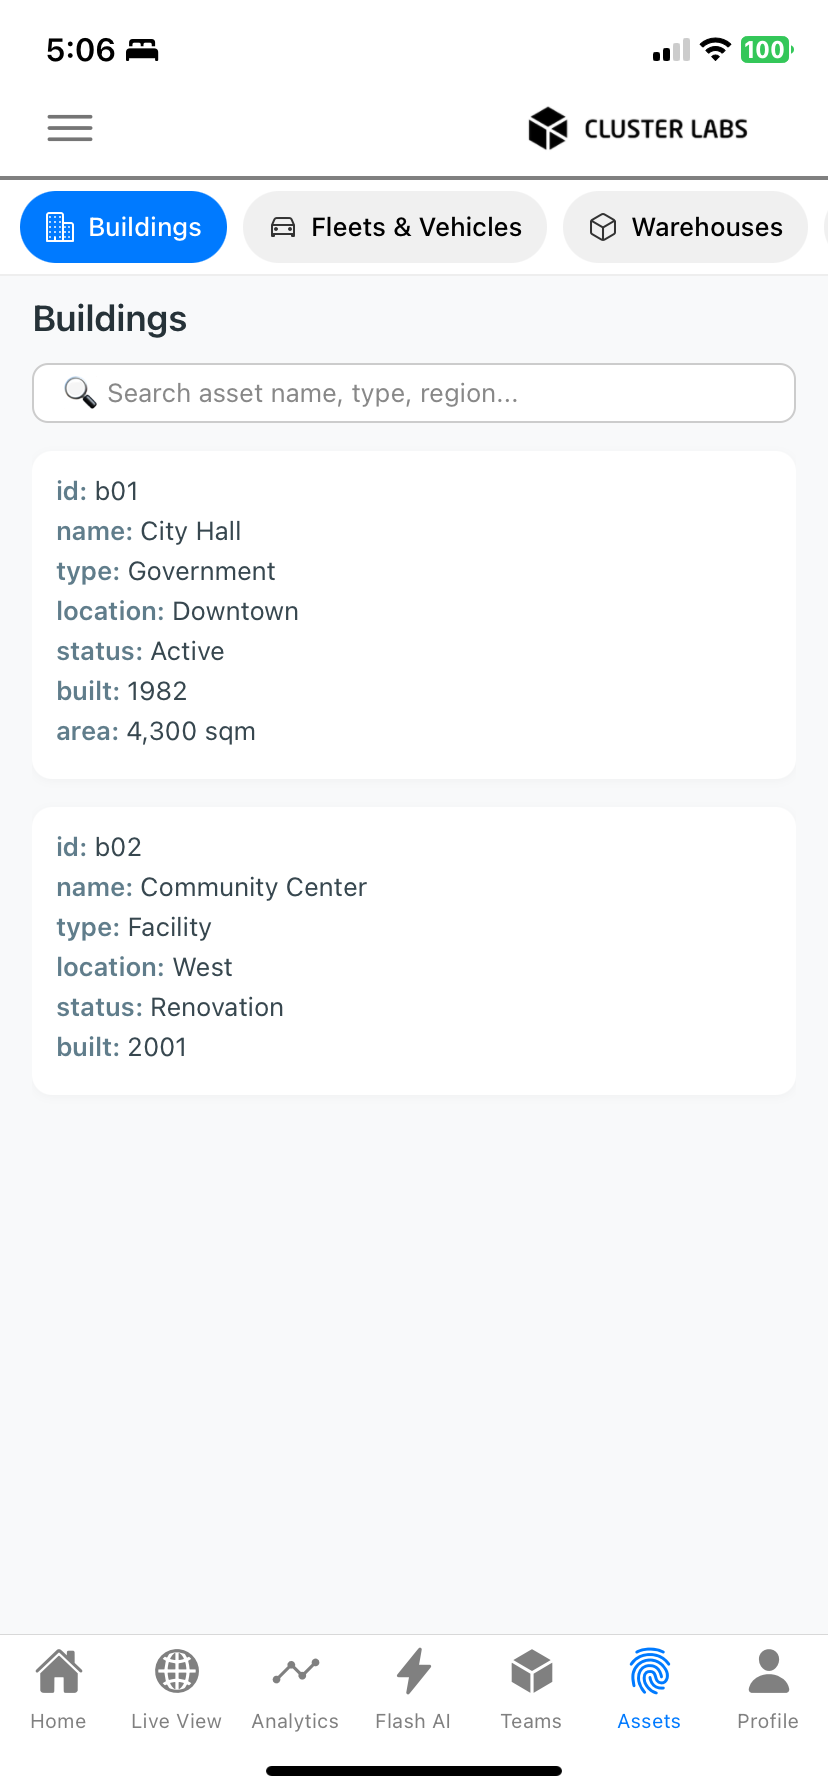
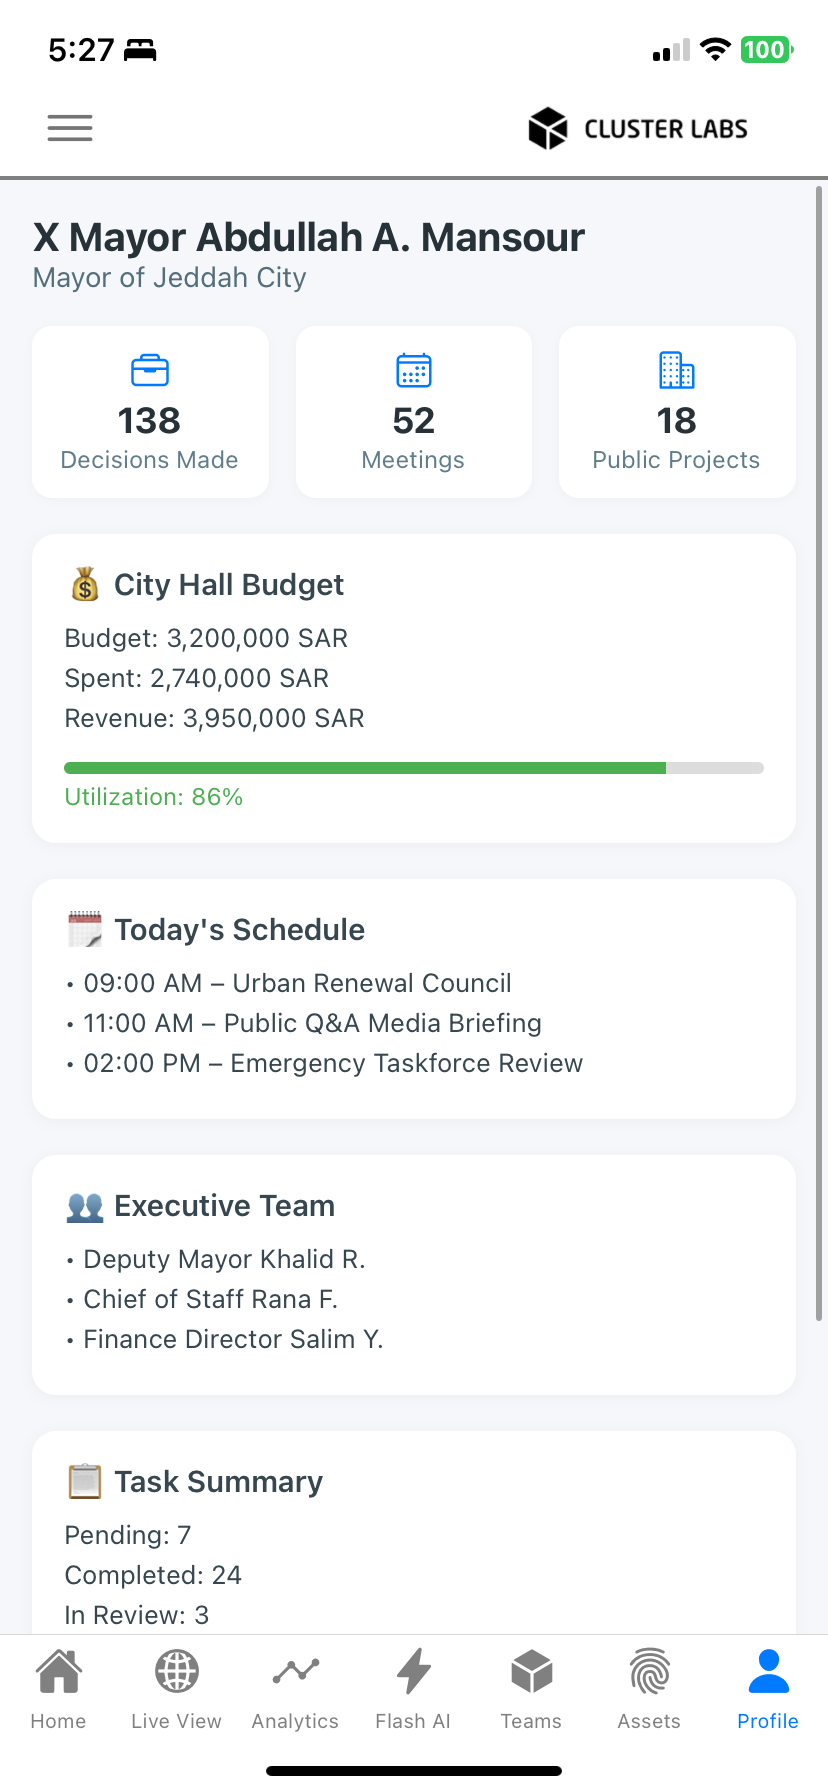
Interface Demo - Mobile (Beta)
“CityAtlas turns siloed urban complexity into a living system - mapped, measured, automated, streamlined, understood.”
- Cluster Labs
Core Capabilities
CityAtlas in Action
Explore how CityAtlas tackles complex challenges, connects ecosystems, and delivers tools tailored for real-world users. Click any section below to dive deeper into the platform’s logic, integrations, and unique value.
-
From GIS to Action Engine - Beyond maps: real-time automation, analytics, reporting, and predictive logic.
Multidisciplinary by Design - Urban, environmental, cultural, and technical data in one frame.
Live + Archival + Predictive = Not just what’s happening - what happened, and what’s coming.
Validated in the Field - Born from real pain points, not hypothetical needs.
Effortless to Use - Plug and Play integrations, analysis, and task tools built for non-technical users.
-
Disconnected GIS / BIM CAD / ERP / IoT data systems.
Inefficient workflows & task duplication.
Inaccessible or underused archival & field data.
Difficulty generating reports or insights from big data.
Limited visibility across city assets, risks, or stakeholder input.
Lost historical context for sites, teams, or planning.
-
Urban Dashboards - zoning, permitting, field teams, public transit, infrastructure status.
Utility Views - resources, energy, pressure, flows, repairs, sensors, field staff.
Cultural Dashboards - site health, restoration, archival overlays.
Real Estate Tools - valuations, occupancy, land use, risk zones.
Rapid Reports - Generate instant visual reports for teams or presentations.
Stakeholder Collaboration - Bring engineers, citizens, and researchers into shared, role-based data environments.
Template & Preset Library - Fast setup for common use cases, designed with field experts.
-
Built-in Data Marketplace
Let stakeholders buy/sell curated datasets.Secure Data Exchange
Researchers, students, or firms can request, access, and contribute data with customisable permissions.API-Driven Integration
Sync with existing apps, data sources, collection platforms - plug & play with full interoperability.
-
Compatible with ERP platforms, CAD, GIS, and BIM systems.
Links with IoT sensors, CCTVs, environmental monitors, and city databases.
Open API for integrating with existing mobile apps, field tools, and reporting systems.
Supports all major file formats and automatically georeferences incoming data.


